Meiosis Diagram: Labeled Stages and Chromosome Behavior
A meiosis diagram is a stage-by-stage illustration of how a single diploid cell divides twice to produce four haploid gametes, each carrying a unique combination of genetic material. Because meiosis involves two separate rounds of division rather than one, a labeled meiosis diagram has to track chromosome behavior carefully across both rounds, since the same-looking chromosomes are doing very different things in each stage. Reading it correctly depends on knowing exactly what separates at each step — whole chromosomes in the first round, individual chromatids in the second.
What a Meiosis Diagram Shows
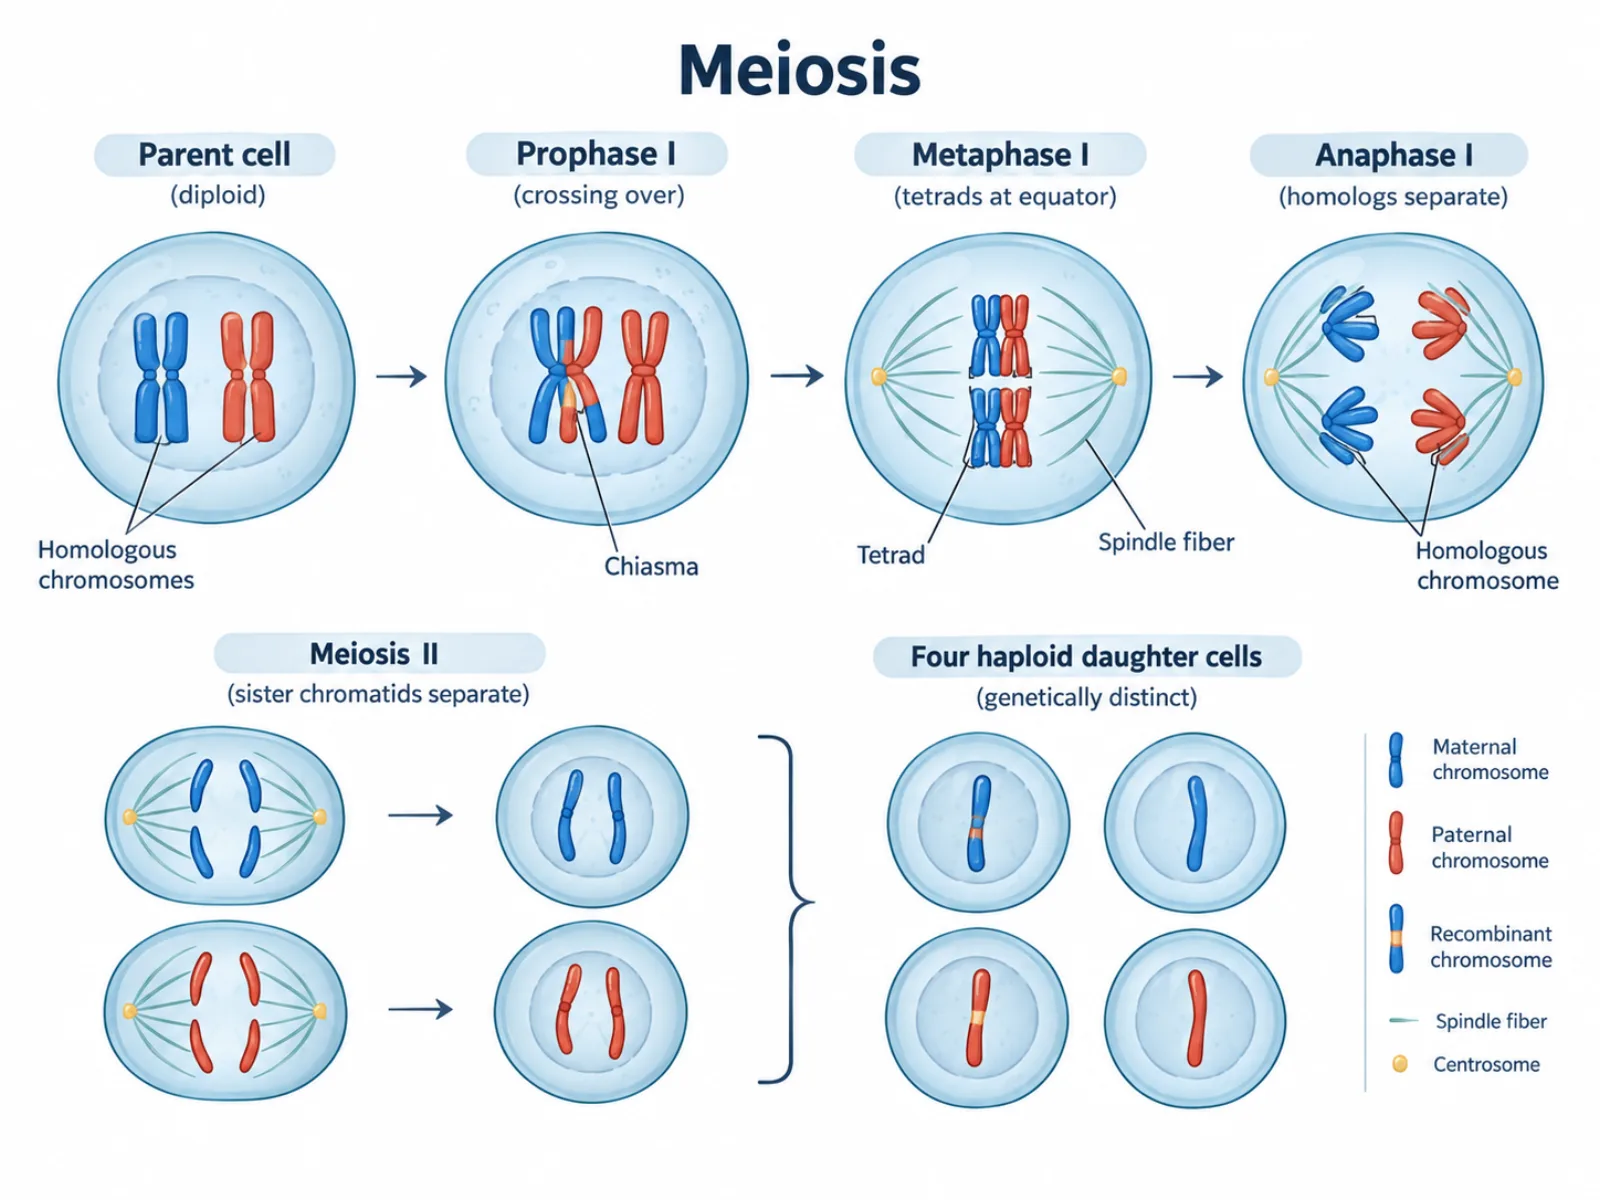
At its core, a meiosis diagram represents the process that produces gametes — sperm and egg cells — with half the chromosome number of the parent cell and genetic variation built into every one of them. This happens through two consecutive divisions, called Meiosis I and Meiosis II, without an intervening round of DNA replication between them. The diagram's job is to show how a starting diploid cell, with its chromosomes arranged in homologous pairs, gets reduced to four haploid cells, each with only one copy of each chromosome and a distinct mix of genetic material shuffled by two separate mechanisms: crossing over and independent assortment.
The Labeled Stages of a Meiosis Diagram
- Prophase I — chromosomes condense, homologous chromosomes pair up into tetrads (bivalents), and crossing over exchanges segments of genetic material between them.
- Metaphase I — tetrads, not single chromosomes, line up at the metaphase plate, with their orientation randomized in a process called independent assortment.
- Anaphase I — whole homologous chromosomes, each still made of two sister chromatids, separate to opposite poles; this step is what halves the chromosome number.
- Telophase I and cytokinesis — two haploid cells form, though each chromosome still consists of two sister chromatids at this point.
- Meiosis II — mechanically similar to mitosis; sister chromatids finally separate, producing four haploid cells that are all genetically different from each other and from the original parent cell.
How to Read the Diagram: Two Rounds, Two Different Separations
The most important skill in reading a meiosis diagram is tracking which structures separate at which stage, since this changes between the first and second rounds of division. In Meiosis I, the key event is the separation of whole homologous chromosome pairs during Anaphase I — one member of each homologous pair goes to each pole, but every chromosome still carries its two sister chromatids intact. In Meiosis II, which proceeds much like an ordinary mitotic division, the sister chromatids of each chromosome are finally pulled apart during Anaphase II. A diagram usually numbers or color-codes the chromosomes (often in two colors representing maternal and paternal origin) so a reader can follow exactly which chromatids end up in which of the four final cells. Proportions matter here too: crossing over in Prophase I is drawn as a small physical overlap between chromatid arms, and even that single localized event is enough to make every resulting gamete genetically distinct.
Common Mistakes When Reading or Drawing a Meiosis Diagram
By far the most common error is confusing what separates in Anaphase I versus Anaphase II — many students describe sister chromatids separating in Anaphase I, when it is actually whole homologous chromosomes (each still holding both chromatids) that separate at that stage; chromatids don't split until Anaphase II. A second frequent mistake is assuming meiosis produces two daughter cells the way mitosis does, when it actually produces four haploid cells through its two rounds of division. A third mistake is placing crossing over at multiple stages or forgetting it entirely; crossing over happens exactly once, during Prophase I, and does not recur in Meiosis II.
How a Meiosis Diagram Differs from a Mitosis Diagram
Meiosis and mitosis diagrams are frequently drawn side by side for direct comparison, since both describe cell division but serve entirely different biological purposes. A meiosis diagram involves two rounds of division and produces four genetically unique haploid cells, intended for sexual reproduction as gametes; it also includes crossing over during Prophase I, a step that introduces new combinations of genetic material not found in either parent. A mitosis diagram, by contrast, involves a single round of division and produces two genetically identical diploid cells, used for growth, tissue repair, and asexual reproduction, with no crossing over involved at any stage. The chromosome number is also handled differently: meiosis halves the chromosome number from diploid to haploid, while mitosis preserves the original diploid number in both daughter cells. Recognizing these differences — cell count, genetic uniqueness, and whether crossing over occurs — is the fastest way to tell the two diagrams apart at a glance.