Cell Cycle Diagram: Phases and Checkpoints
A cell cycle diagram is a circular illustration showing the repeating sequence of growth, DNA replication, and division that a eukaryotic cell goes through between one division and the next. The circular shape is deliberate: once a cell finishes dividing, its two daughter cells each start the same cycle over again, so a cell cycle diagram has no true beginning or end, only a repeating loop. Reading a cell cycle diagram accurately means paying close attention to how much of the circle each phase actually occupies, since the proportions carry real biological meaning about how a dividing cell spends its time.
What the Cell Cycle Diagram Shows
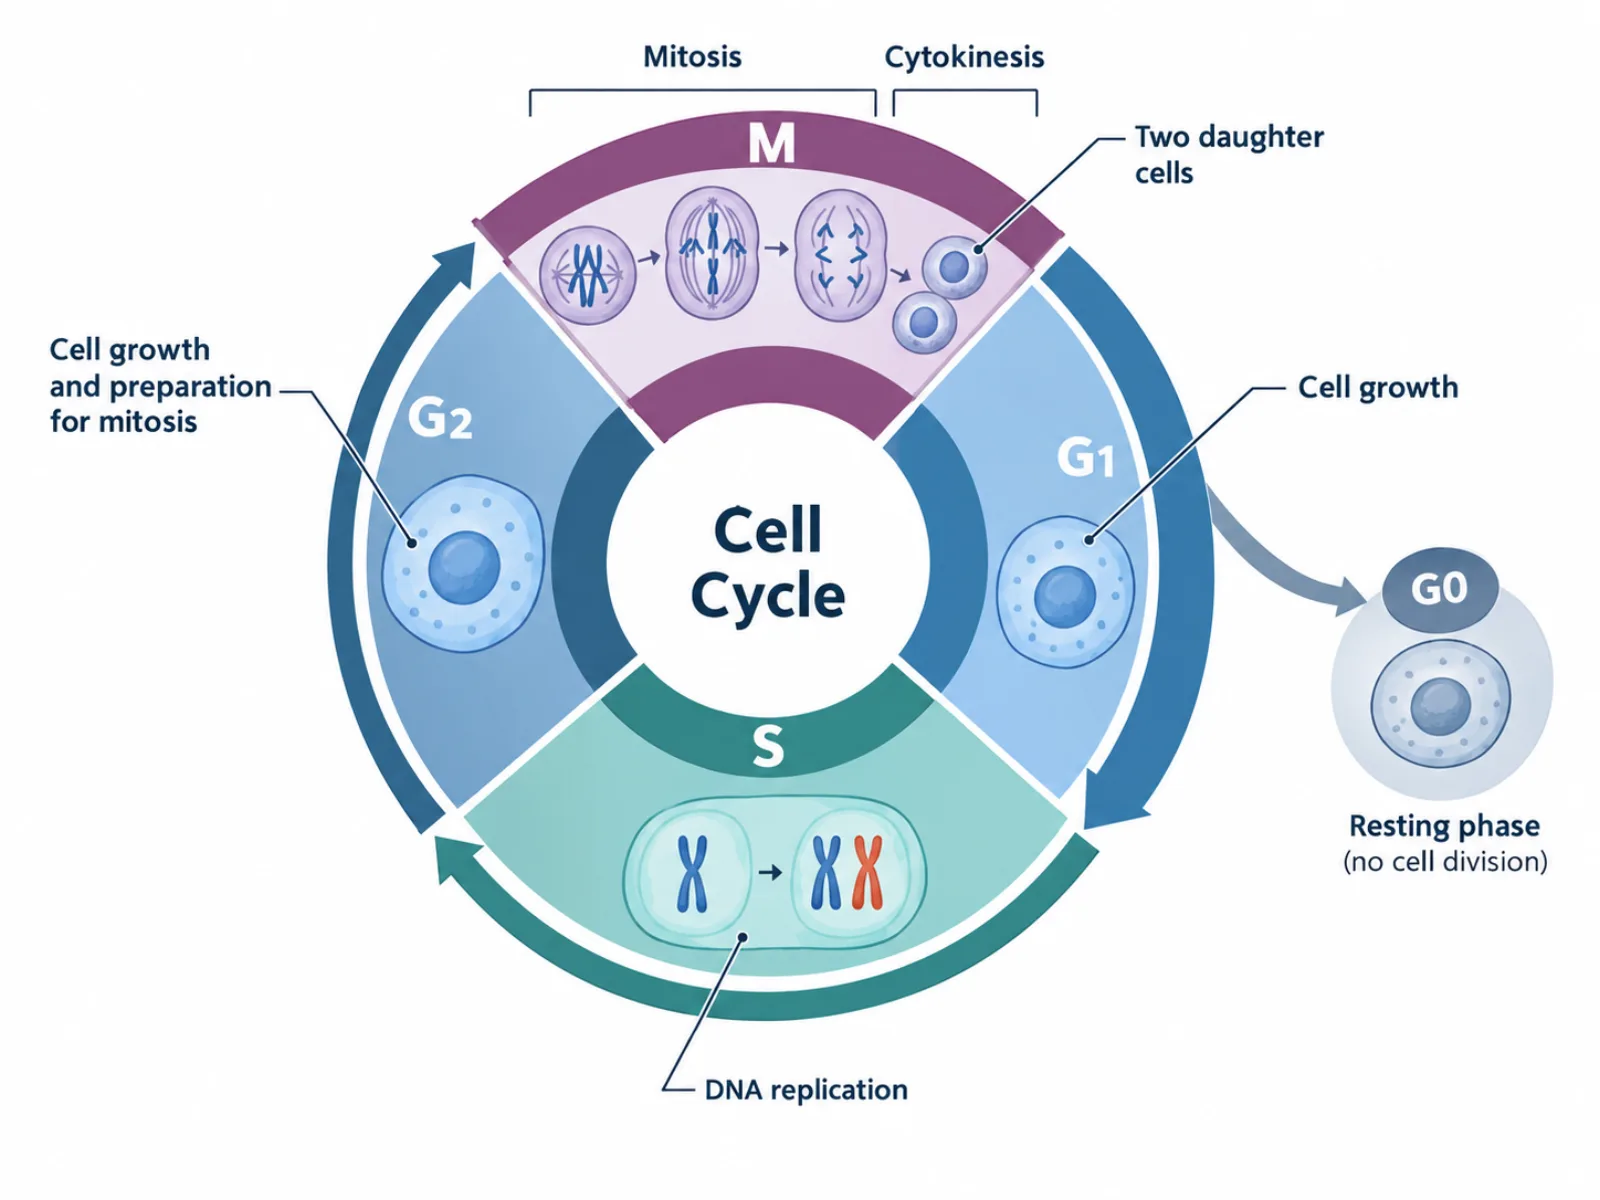
The diagram divides the circle into two broad segments: interphase, which occupies the large majority of the circle, and the M phase, a comparatively small wedge covering active division. Interphase itself is broken into three sub-phases — G1, S, and G2 — representing growth, DNA replication, and further preparation, respectively. The M phase, by contrast, covers the visible mechanics of splitting one cell into two: nuclear division followed by division of the cytoplasm. A complete cell cycle diagram also shows a branch point, usually near G1, leading to a separate resting state outside the main loop.
The Labeled Phases and What Happens in Each
- G1 (Gap 1) — the cell grows, duplicates its organelles, and passes a checkpoint confirming it is ready to commit to DNA replication.
- S phase (Synthesis) — the cell's DNA is replicated, so each chromosome now consists of two identical sister chromatids joined together.
- G2 (Gap 2) — the cell continues growing and synthesizes proteins needed for division, then passes a checkpoint confirming DNA was copied correctly.
- M phase (Mitosis and cytokinesis) — mitosis divides the duplicated nuclear material through prophase, metaphase, anaphase, and telophase, and cytokinesis then splits the cytoplasm into two separate daughter cells.
- G0 (resting phase) — a branch off the main cycle where cells exit division and enter a stable, non-dividing state; most mature neurons remain in G0 permanently.
- G1/S checkpoint — verifies conditions such as DNA integrity and adequate cell size before allowing entry into S phase.
- G2/M checkpoint — confirms that DNA replication completed correctly and without damage before mitosis begins.
- Spindle assembly checkpoint — occurring during metaphase, confirms that every chromosome is correctly attached to spindle fibers before anaphase is allowed to proceed.
How to Interpret the Cell Cycle Diagram: Reading the Circle
A cell cycle diagram should be read moving clockwise around the circle, starting at G1 and proceeding through S, G2, and M before returning to G1 in the next generation of cells. The relative size of each wedge in the circle is not arbitrary — interphase should occupy a visibly larger arc than the M phase, reflecting how dividing cells actually spend the majority of their time growing and preparing rather than actively splitting. Checkpoints should be marked as distinct points along the circle's boundary, not as phases with their own duration, since each one represents a brief verification step rather than an extended stage. The G0 branch should be drawn departing from the main loop near G1, visually separate from the continuous circular flow, since a cell in G0 is not progressing toward division at all.
Common Mistakes When Reading or Drawing a Cell Cycle Diagram
The most common misconception is assuming mitosis, the M phase, takes up most of the cell cycle's total duration, likely because it is the most visually dramatic and heavily illustrated part of the process. In reality, interphase accounts for roughly 90% of the total cycle time in most dividing human cells, with the M phase completing in a relatively short span by comparison. A second common mistake is omitting G0 from the diagram entirely, treating the cycle as a closed loop with no exit, when G0 is a distinct and biologically significant branch for cells like neurons that stop dividing altogether. A third mistake is confusing what each checkpoint actually verifies — mixing up the G1/S checkpoint's focus on readiness to replicate DNA with the spindle assembly checkpoint's focus on correct chromosome attachment during metaphase, when each checkpoint guards a different, specific condition.
Cell Cycle Diagram vs. Mitosis Diagram
A cell cycle diagram and a mitosis diagram are frequently confused because mitosis is part of the cell cycle, but they operate at different levels of detail. The cell cycle diagram is the full circular process, including the growth and DNA replication that happen during interphase as well as the division itself, while a mitosis diagram zooms into only the M phase segment of that circle to break it down further into prophase, metaphase, anaphase, and telophase. It is also worth distinguishing both from meiosis, which is a separate, specialized type of cell division used specifically to produce gametes (sperm and egg cells) and is not part of the standard somatic cell cycle shown in a typical cell cycle diagram.