

Map a story's exposition, rising action, climax, falling action, and resolution onto one editable story mountain, right in your browser.
A plot diagram is a visual map of a story's structure, drawn as a line that rises from a low starting point to a single peak and then descends again. Each landmark on that line — exposition, inciting incident, rising action, climax, falling action, and resolution — marks a stage in how the plot builds and releases tension. Teachers call the shape a story mountain because the climb represents growing conflict and the descent represents that conflict working itself out. Filling one in forces a reader to separate what happens from why it matters to the plot, which is why the tool shows up constantly in reading comprehension units from elementary school through high school English.
Plotting a story this way turns a long narrative into six checkpoints a student can hold in their head at once. Instead of retelling a book chapter by chapter, a learner has to decide which single event counts as the inciting incident, which events actually raise the stakes on the way to the climax, and which details are just rising action rather than the turning point itself. That decision-making is the real skill behind a plot diagram assignment — the diagram is only the record of it. Because the six stages apply to almost any story with a clear conflict, the same framework works for a fairy tale, a short story, or a full-length play.
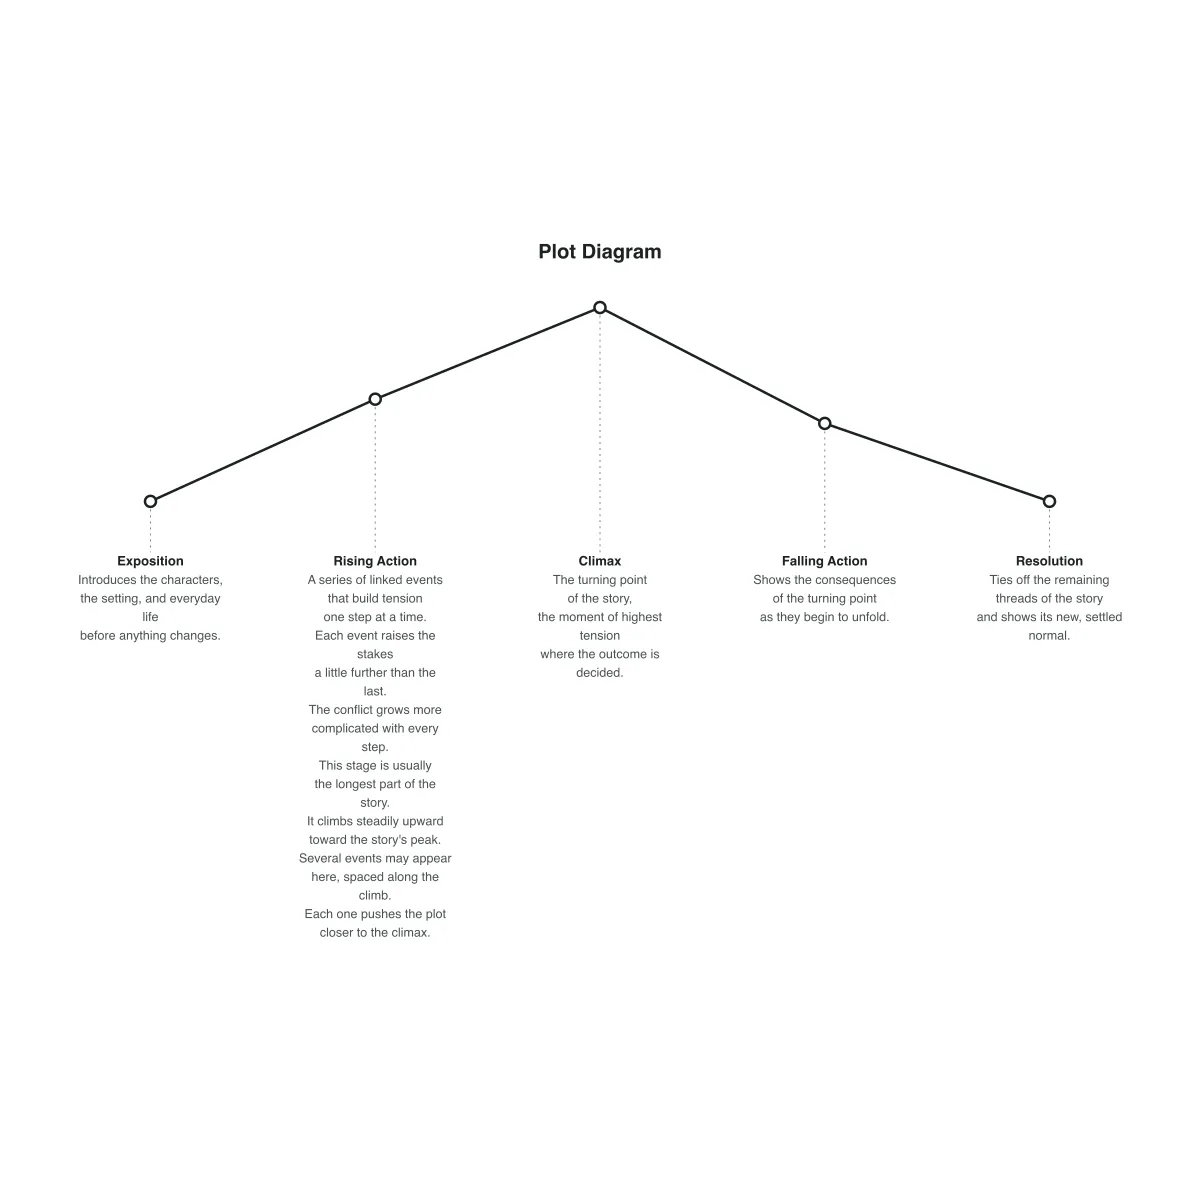
Each stage has a specific job. Exposition introduces the characters, setting, and the world's normal rules before anything goes wrong. The inciting incident is the single event that disrupts that normal and starts the central conflict moving. Rising action is everything that follows — usually several linked events — that raises tension and complicates the conflict on the way up. Climax is the turning point, the moment of highest tension where the outcome is decided. Falling action shows the consequences of that turning point starting to unfold, and resolution ties off the remaining threads and shows the story's new normal.
Four ways this plot diagram maker gets used, from a picture-book fairy tale to a student mapping out an original story before writing a single scene.
The classic fairy tale mapped across all six stages, with three rising-action events — the stepmother's cruelty, the fairy godmother's magic, and the midnight deadline — spaced along the climb to the climax.
A high school literature diagram that tracks the feuding families through the secret marriage and Tybalt's death up to the play's climax, showing that a plot diagram works as well for tragedy as for a fairy tale.
A simplified five-point diagram for early elementary grades, folding the inciting incident into rising action so beginning readers track fewer labels while still following the wolf's three attempts to blow the houses down.
A student's prewriting diagram for an original short story, filling in the climax first and working outward to plan which events need to happen earlier to earn that turning point.
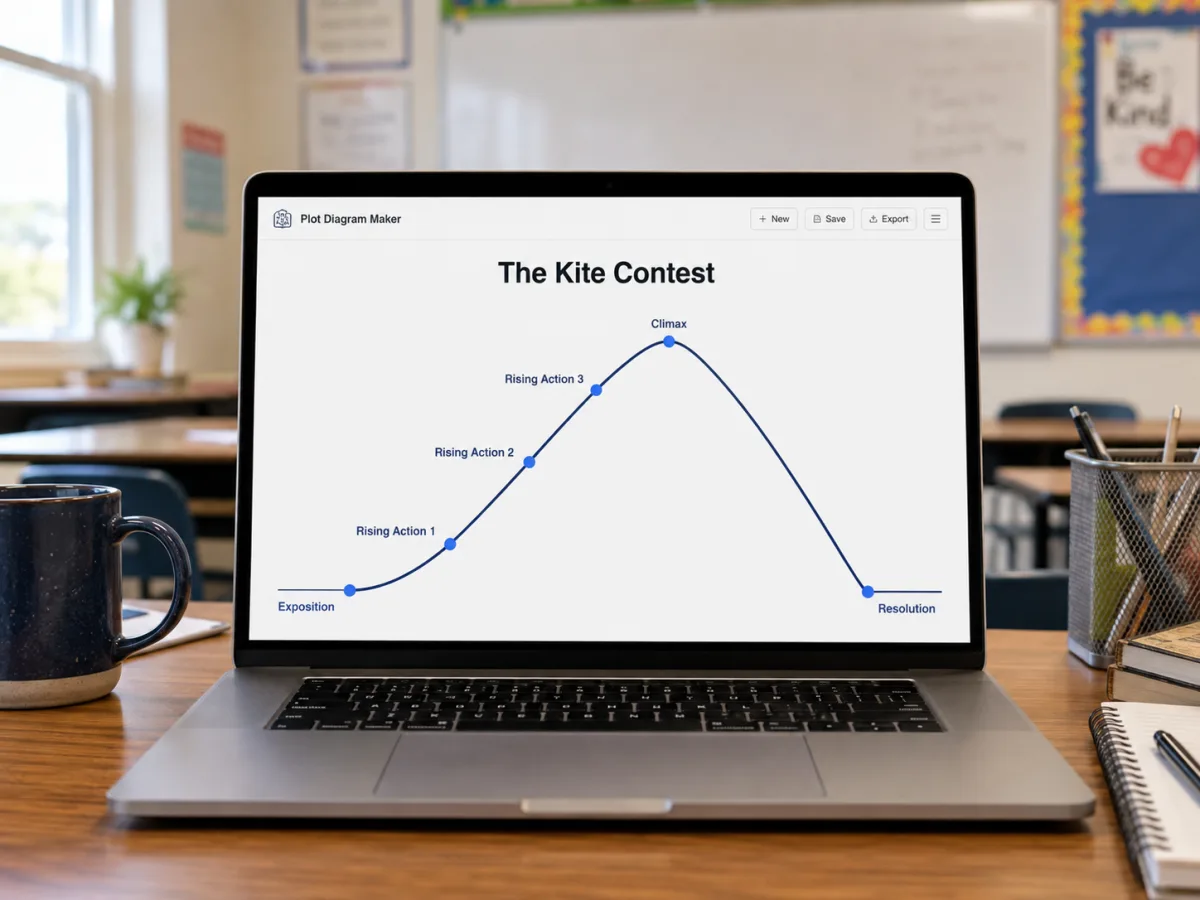
Add a second or third rising-action event and the incline recalculates on the spot, spacing every point evenly between the inciting incident and the climax instead of leaving one crowded corner. Drop back to a single event and the slope straightens out again, so the shape always reflects how many turns the plot actually takes.
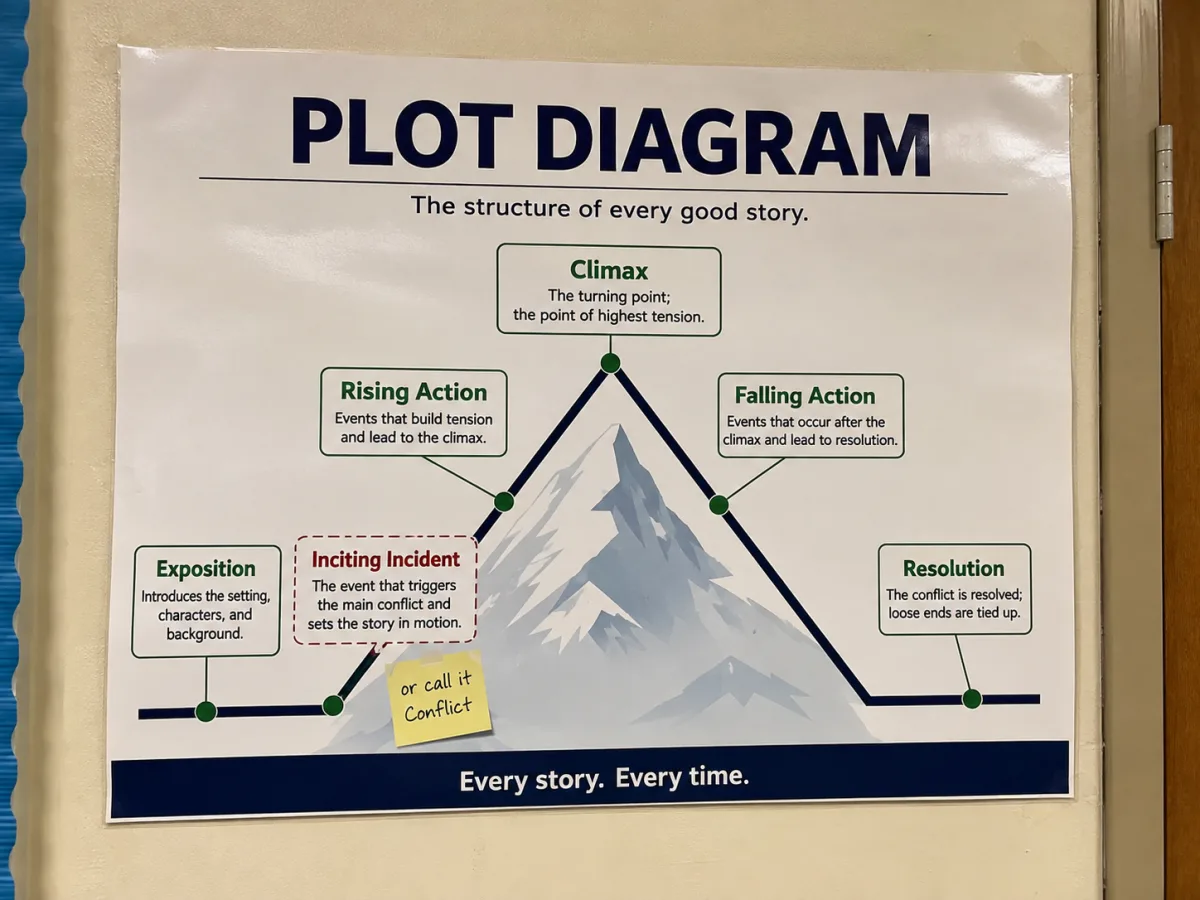
Every stage label on the mountain is a text field, not a fixed caption. Switch to the five-point layout to fold the inciting incident into rising action for younger readers, or keep all six and relabel them to match a district's own terms — "conflict" instead of "inciting incident," for instance.
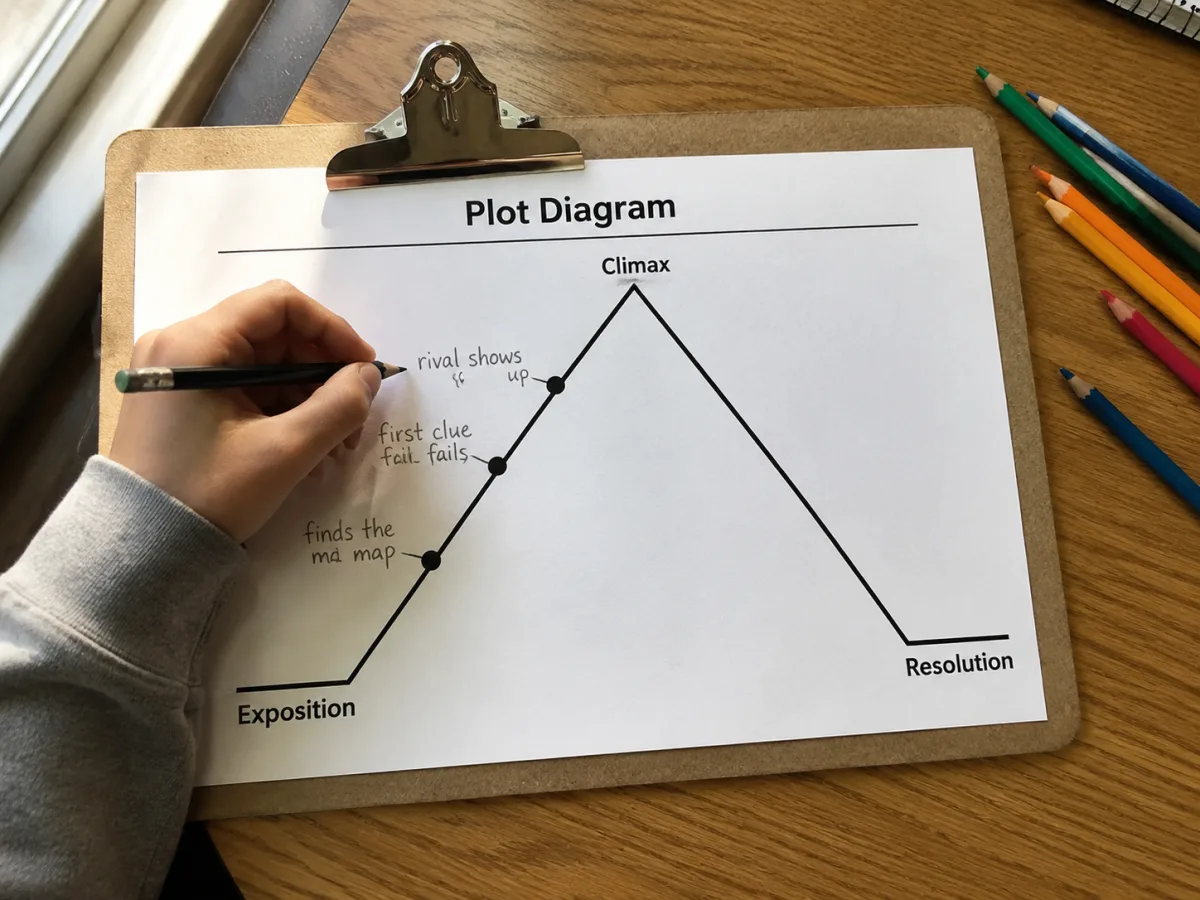
Most plot diagram templates give rising action a single box, even though it usually covers more of the story than any other stage. This one lets you add up to three separate events, each with its own point on the climb, so a student can show the stepmother's cruelty, the fairy godmother's magic, and the midnight deadline as three distinct beats instead of one paragraph.
The five-stage shape used in classrooms today has a specific, older ancestor.
Gustav Freytag's structure for analyzing five-act drama
The teaching simplification used in reading comprehension today
Here is how this generator turns a story into a finished plot diagram, stage by stage.
Choose the six-point version to keep exposition and the inciting incident separate, or the five-point version to fold the inciting incident into rising action for a shorter list of stages.
Type the story title, then work through exposition, the inciting incident (if you kept it), each rising-action event, the climax, falling action, and resolution.
Use one rising-action event for a short story with a single complication, or add up to three for a plot with several linked turns, and watch the incline resize to fit.
Download the plot diagram as an SVG for further editing or a PNG ready to drop into a worksheet or slide, once every stage reads the way you want.
Common questions about building and using a plot diagram.
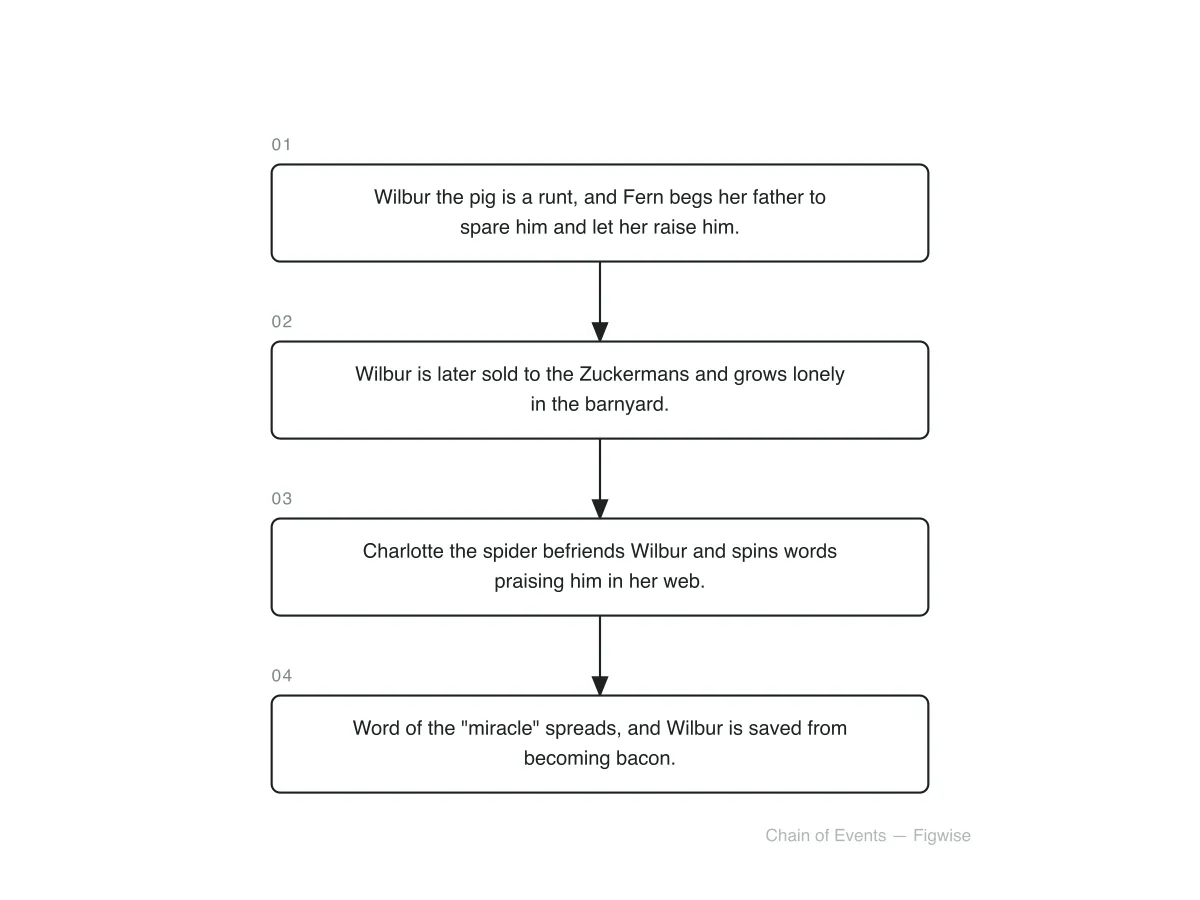
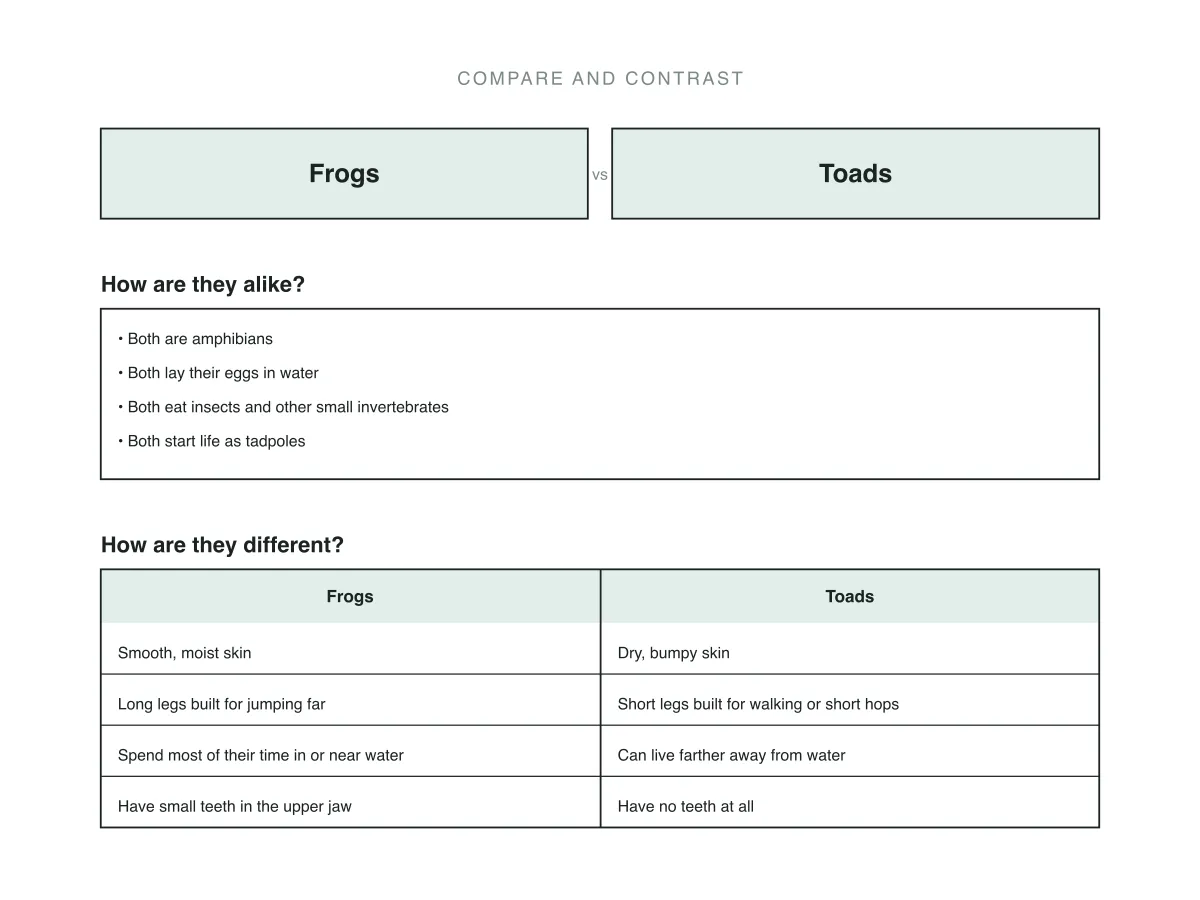
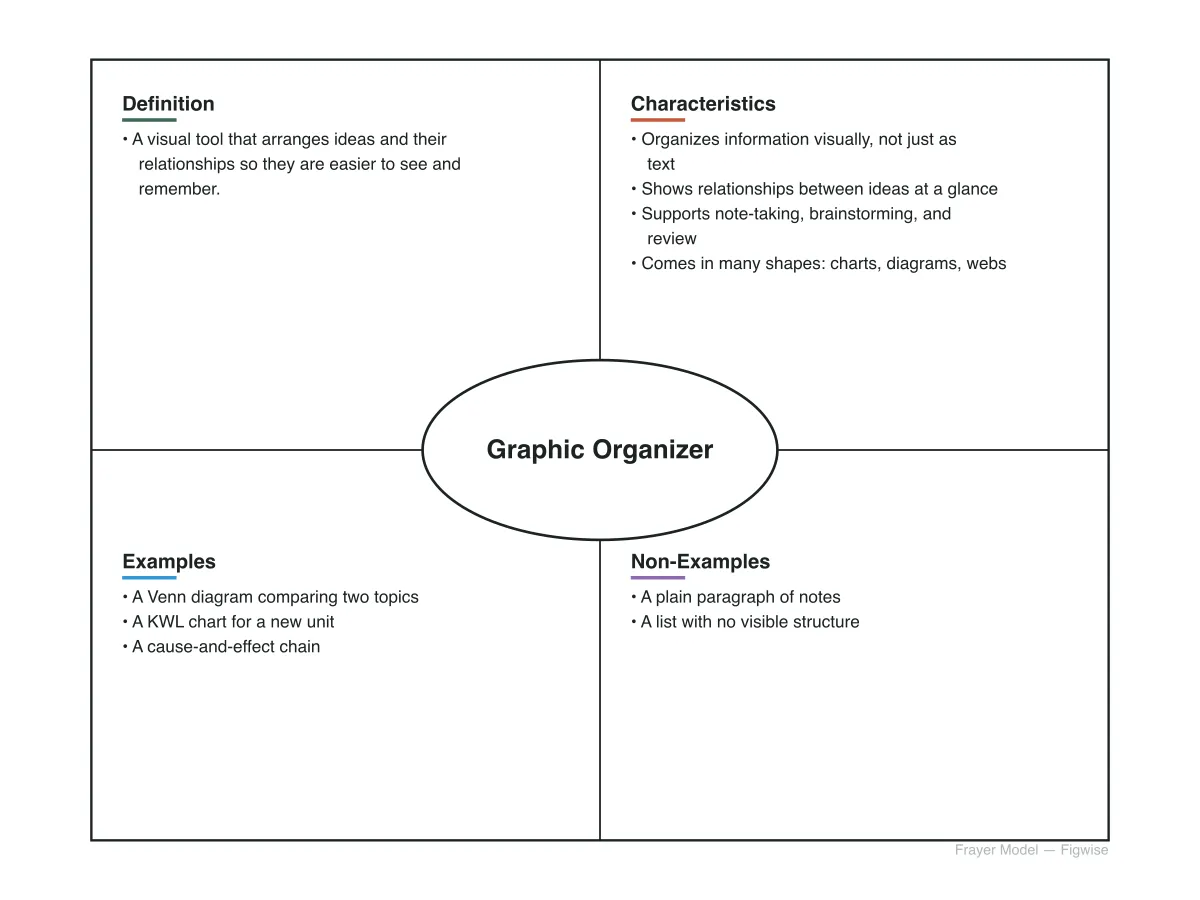
Other diagram-based organizers for tracking a text's structure.
Fill in the six stages above and watch the mountain redraw itself as you write, right in your browser.