

Build a KWL chart online: fill in what you Know, what you Want to know, and what you Learned, then export a clean SVG or PNG to print or drop into a worksheet — free, no signup.
A KWL chart is a three-column graphic organizer that structures a lesson or research project around what a learner already knows, wants to know, and eventually learns. The letters' meaning matches the order you fill them in: K and W are completed before the material is covered, and L is added afterward. Reading specialist Donna Ogle introduced the format in a 1986 article in The Reading Teacher, originally as a strategy for guiding students through nonfiction text. It has since spread well beyond reading class into science, history, and general classroom instruction.
The K column captures prior knowledge before instruction starts, because new information sticks better when it connects to something a learner already holds. The W column turns that starting point into purpose: students write down genuine questions, not just topics, giving them something specific to look for while reading or during a lab. The L column is filled in last, once the lesson is finished, and works best when checked against the original W questions — noting which were answered and what surprised them along the way.
Because the format is just three labeled columns, a KWL chart works on paper, a whiteboard, or a shared document, scaling from a single student's notebook to a whole class working from one projected chart. Teachers use it to open a unit and check for misconceptions before they take root; independent learners use a lighter version to scope a reading list or a research question before diving in. The chart doesn't grade anything on its own — it makes a start-of-topic and an end-of-topic snapshot easy to compare.
Four ways teachers and self-directed learners fill in a KWL chart before, during, and after a unit.
A middle school science class starts a volcanoes unit by filling in the K and W columns together, then returns to the L column after the unit's lab and reading are done.
Before a lesson on the Civil Rights Movement, students record what they already know and the questions they want answered, giving the teacher a quick read on prior knowledge and gaps.
A reading teacher uses the chart as a pre-reading strategy for a nonfiction article on ocean plastic pollution, then fills in the L column as a post-reading comprehension check.
A graduate student scopes a literature review by listing what the existing research already establishes, the open questions worth chasing, and what the reading turns up once the search is done.
Here is how this KWL chart maker turns a topic into a filled-in, exportable chart.
Before the lesson or reading starts, list what you or your students already know in the K column — short phrases are fine, this is a starting inventory, not an essay.
In the W column, turn gaps in that knowledge into real questions. Specific questions give the reading or unit something concrete to answer, instead of a vague topic label.
After the lesson, reading, or research is done, fill in the L column and check it against the W questions — mark which were answered, which weren't, and add anything unexpected.
Download the finished chart as SVG or PNG, then print it, drop it into a worksheet, or project it on a whiteboard for the whole class to fill in together.
Both formats share the same K and W columns; the difference is what happens between asking the question and answering it.
Three columns, straight from question to answer
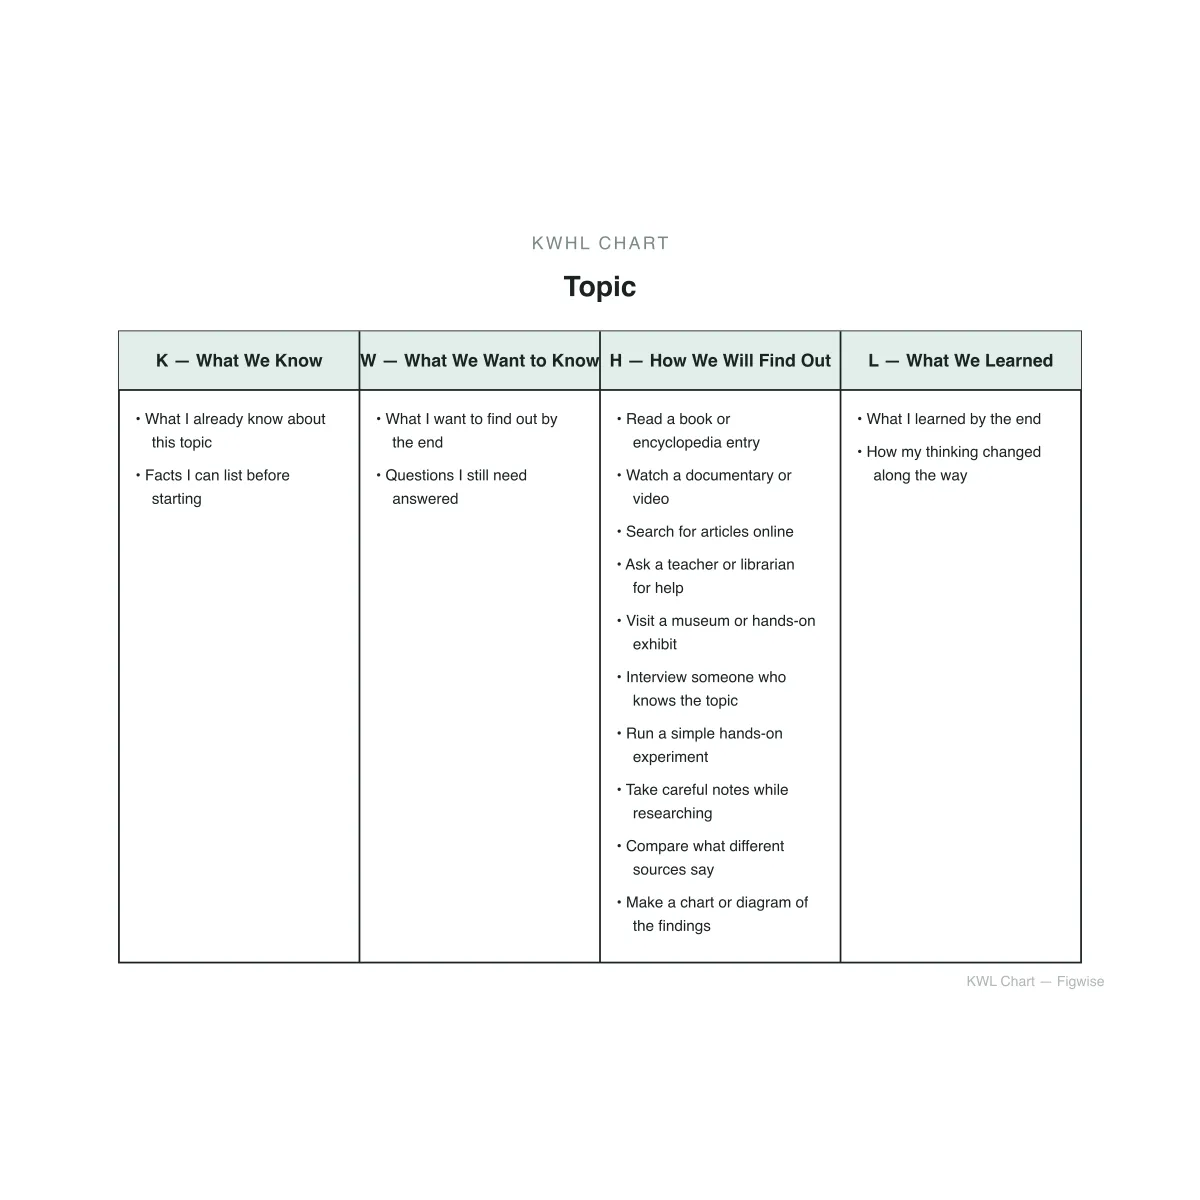
Adds an H column between W and L
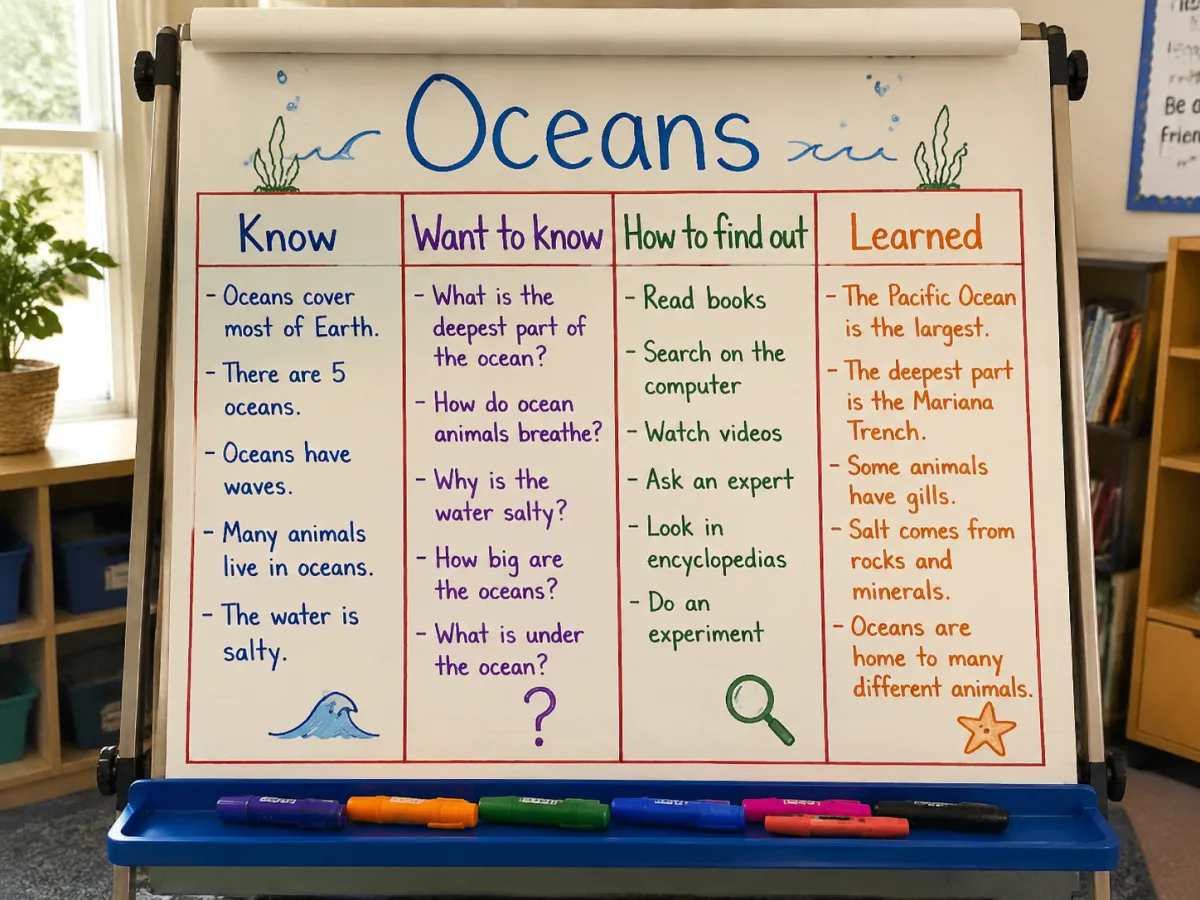
Rename any column heading to fit your lesson, or switch the whole chart from three columns to four when a project needs an explicit How column between Want to know and Learned.
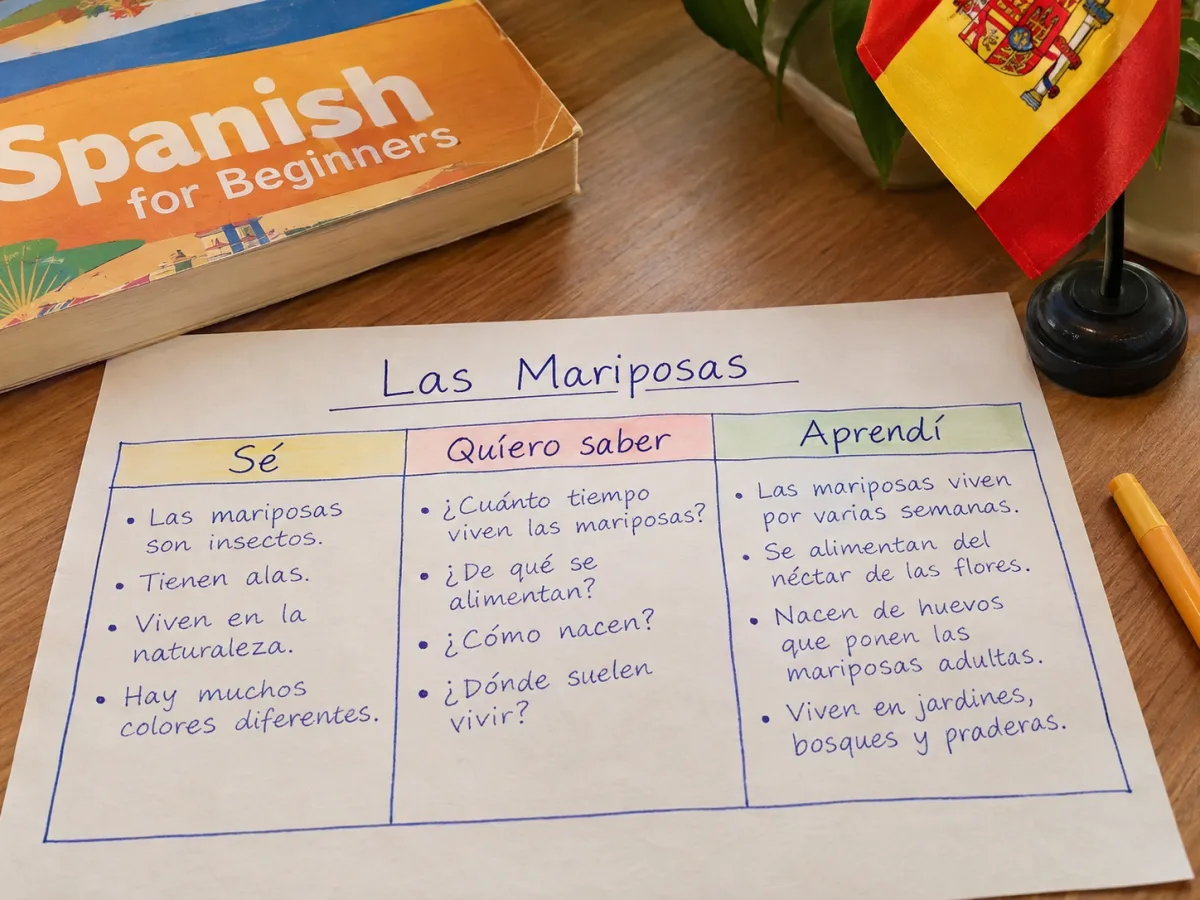
Download the chart as SVG for further editing or PNG for a worksheet, then print it as a class handout or project it on a whiteboard for the group to fill in together.
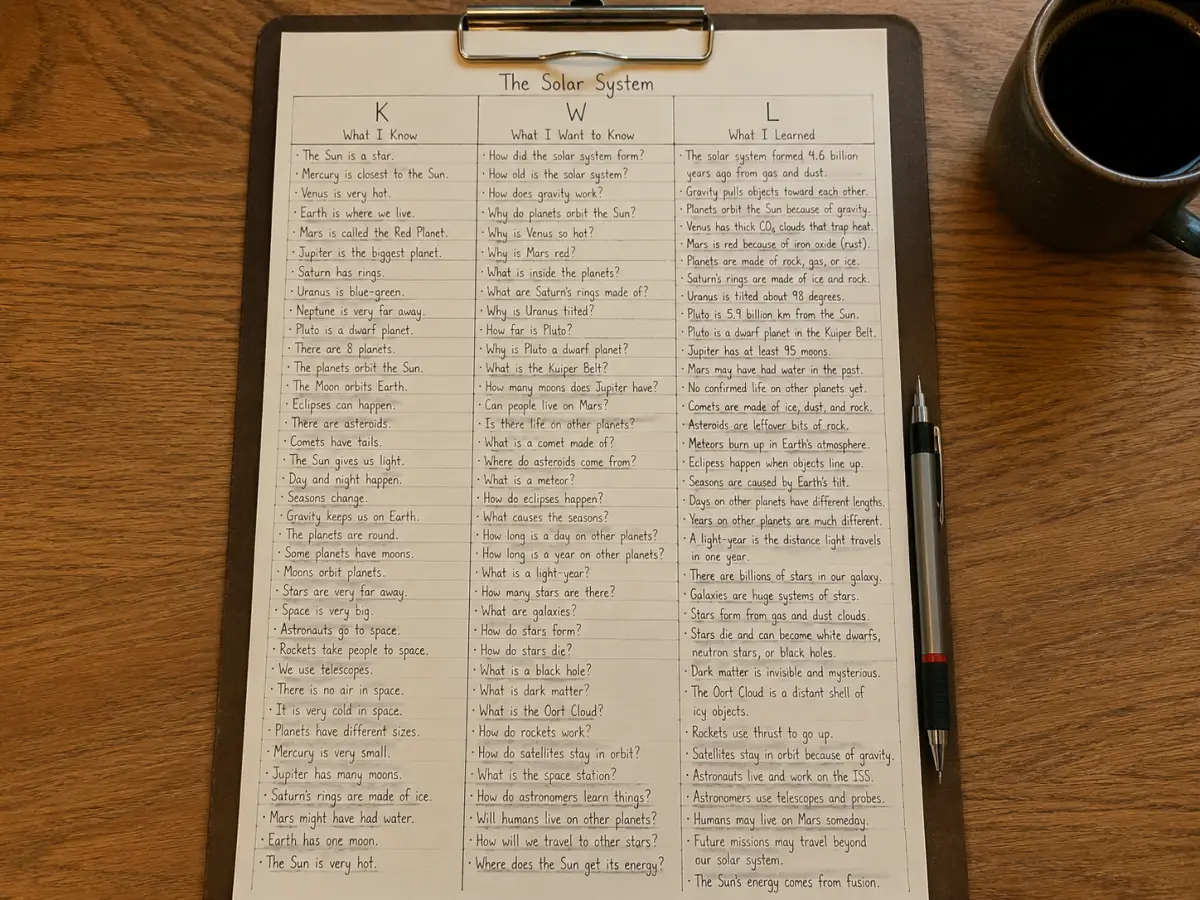
Add ten items to Know and just two to Want-to-know, and the chart still lines up cleanly — the whole table height adjusts to whichever column has the most entries, so long lists never spill past the border or get clipped.
Answers to the questions people most often ask about building and using a KWL chart.
Fill in what you know, what you want to know, and export a clean, printable chart — all in your browser.