

Draw a 2 or 3 circle Venn diagram by typing labels and colors for each set, then filling in what belongs to every overlapping region — free, no signup.
A Venn diagram is a chart that uses two or more overlapping circles to show how different groups of items relate to each other. Each circle represents one category or set, and the space where circles overlap holds the items both sets share.
The mathematician John Venn popularized this style of diagram in 1880, and it remains the standard way to visualize set theory: the overlap between two circles is their intersection, often written A ∩ B, while everything inside either circle but outside the overlap belongs to just one set.
Most Venn diagrams use two or three circles because a fourth overlapping circle stops producing simple, evenly shaped regions. Two circles are enough for a straightforward comparison; three let you show every combination among three categories at once, from single traits to what all three share.
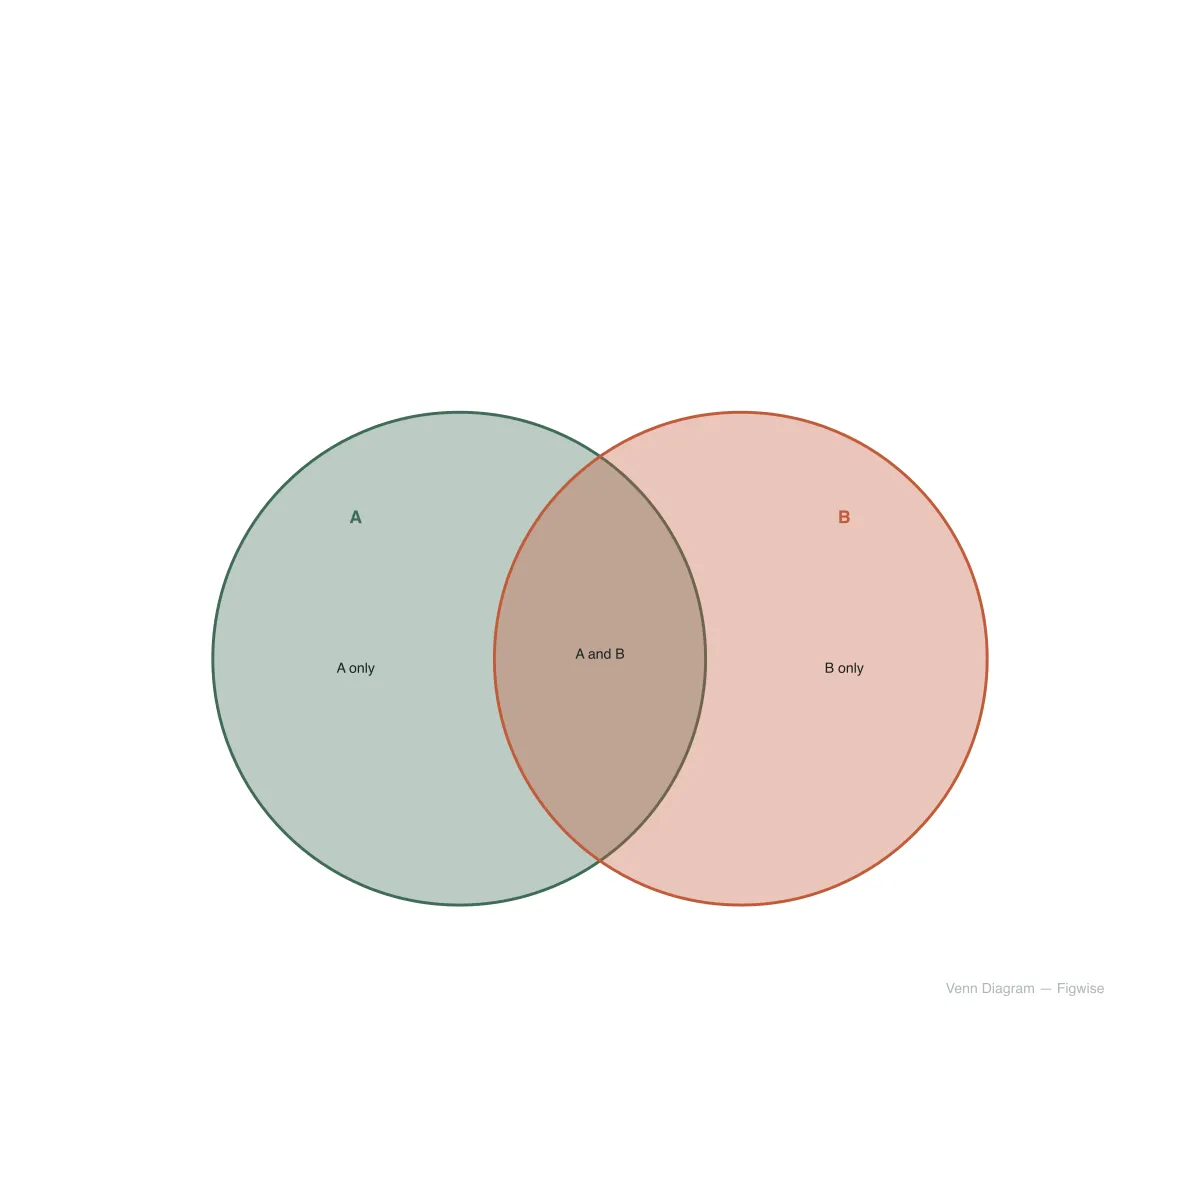
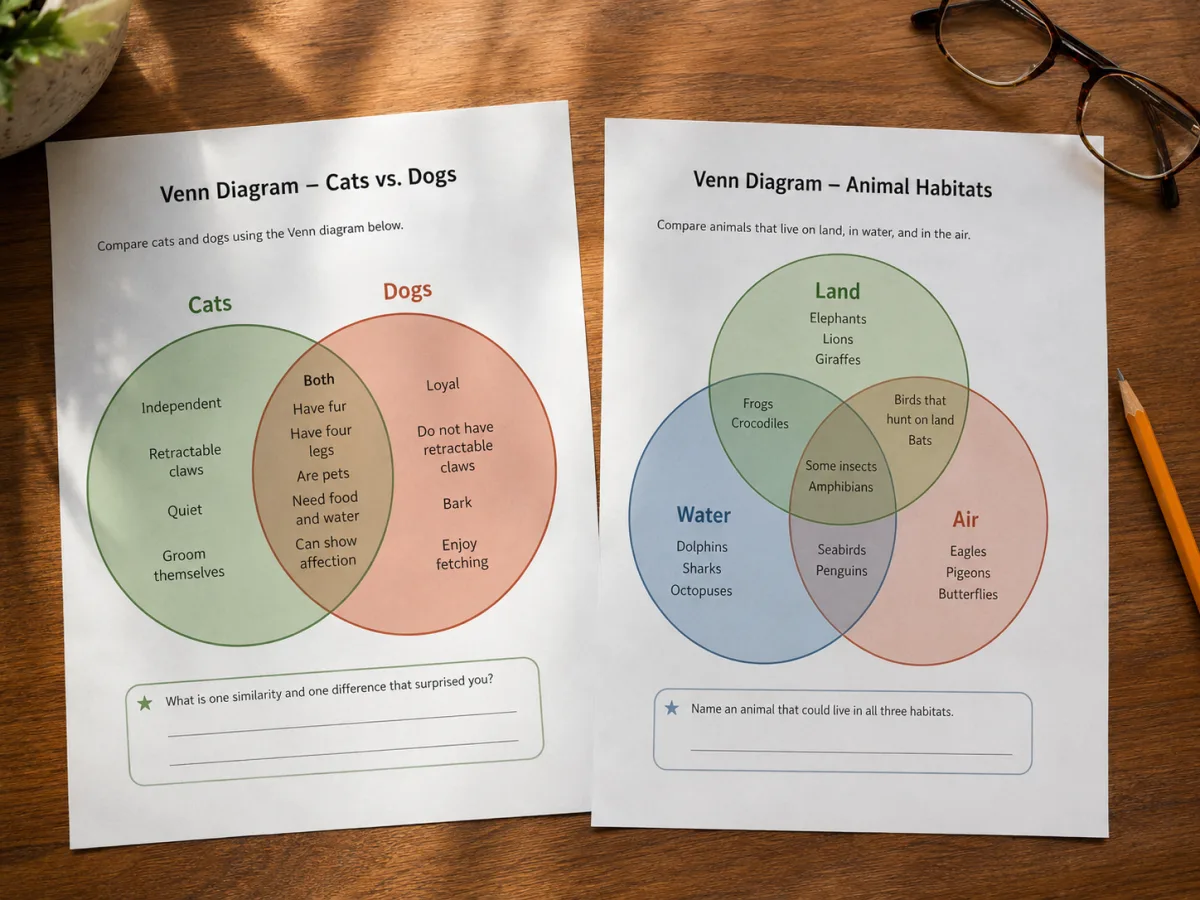
Pick the number of circles once and the whole venn diagram generator rebuilds the layout for you — two overlapping circles for a simple comparison, or three arranged in the classic triangular pattern when you need to cross three categories at once. Switching modes resets the regions cleanly, so you never end up editing text that no longer has a circle to sit in.
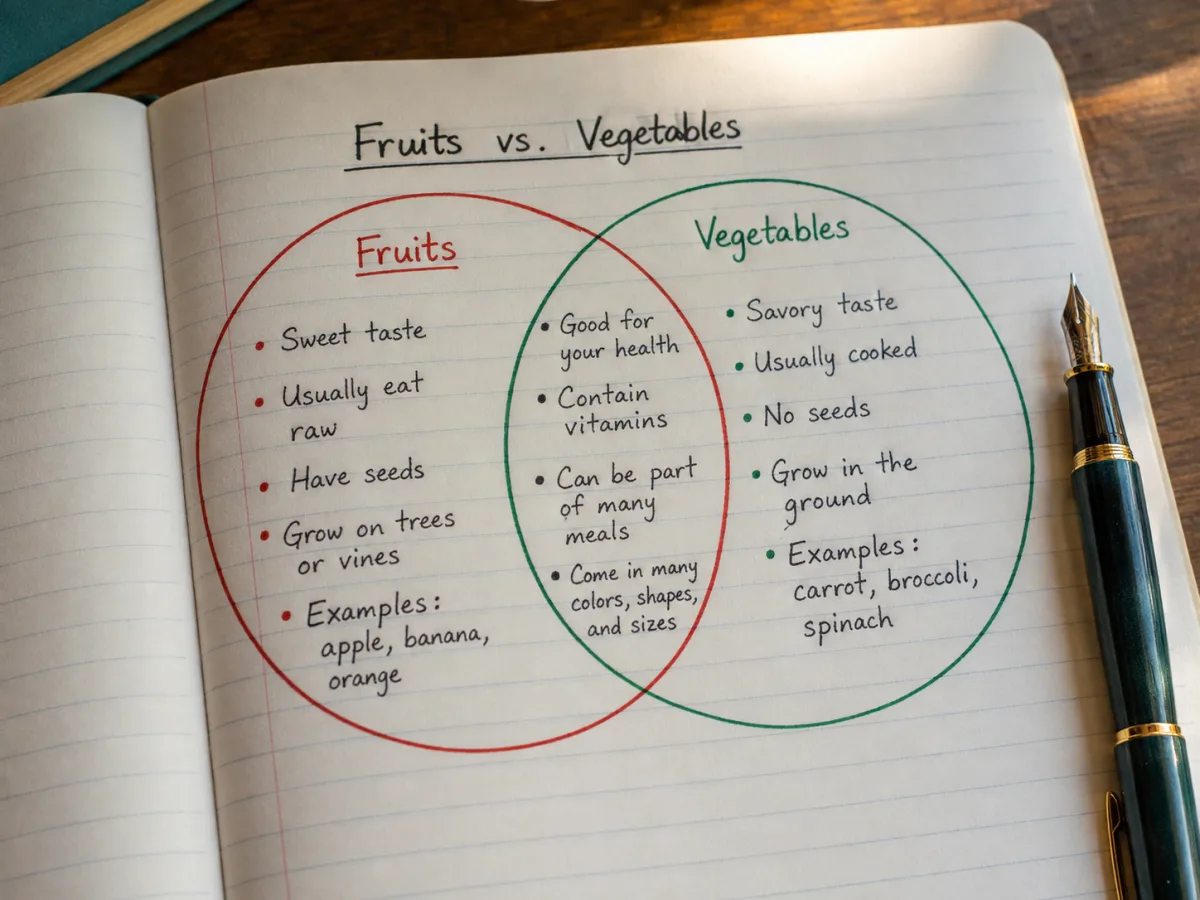
Every region of the diagram — each circle's own space plus every overlap, down to the small area shared by all three sets — gets its own text box. List one item per line and the generator wraps and centers the text inside that region automatically, so you never have to nudge labels by hand to keep them from spilling outside the circle.
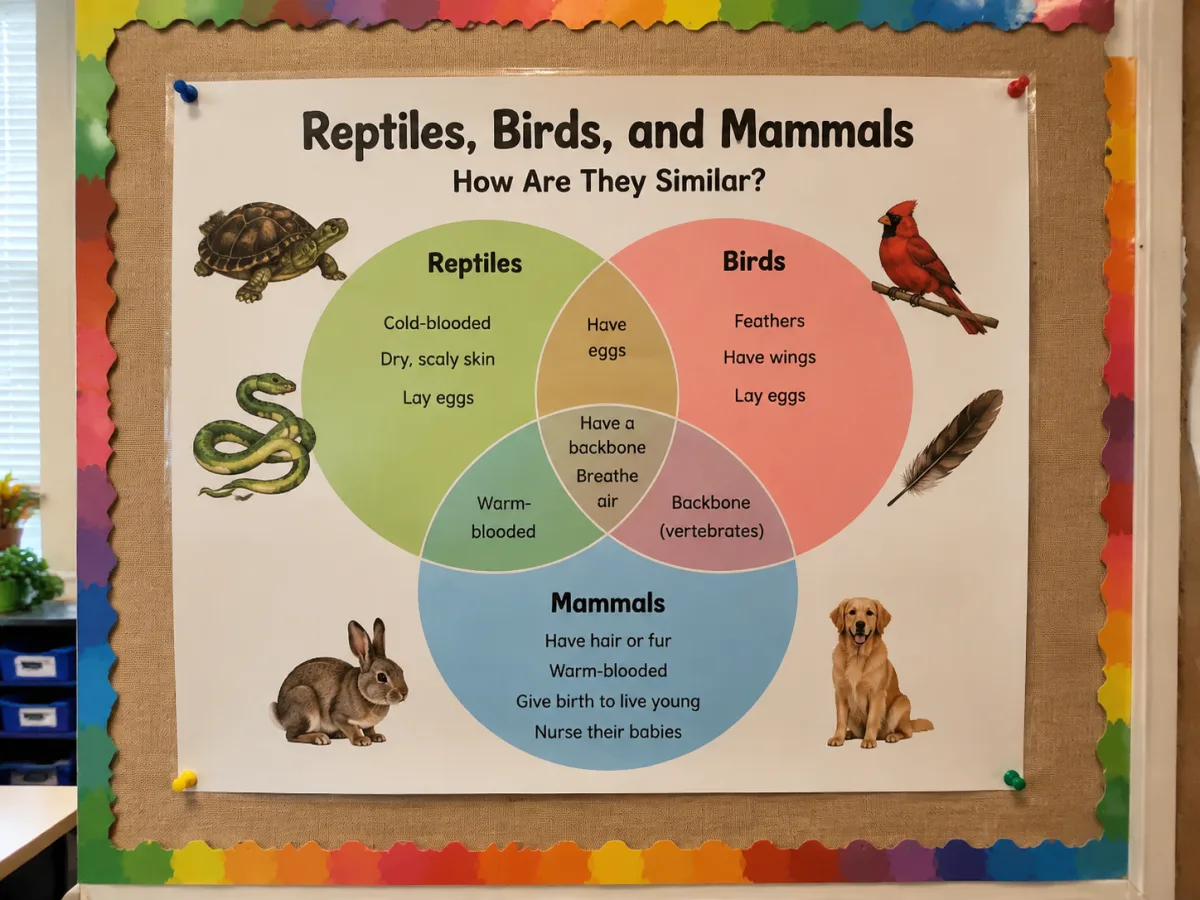
Each set gets its own color, applied to the circle as a semi-transparent fill with a solid outline, so two overlapping circles blend into a visibly distinct shade exactly where their sets intersect. Pick any hex color per set, or keep the defaults this venn diagram maker assigns automatically for a diagram that reads clearly in print or on screen.
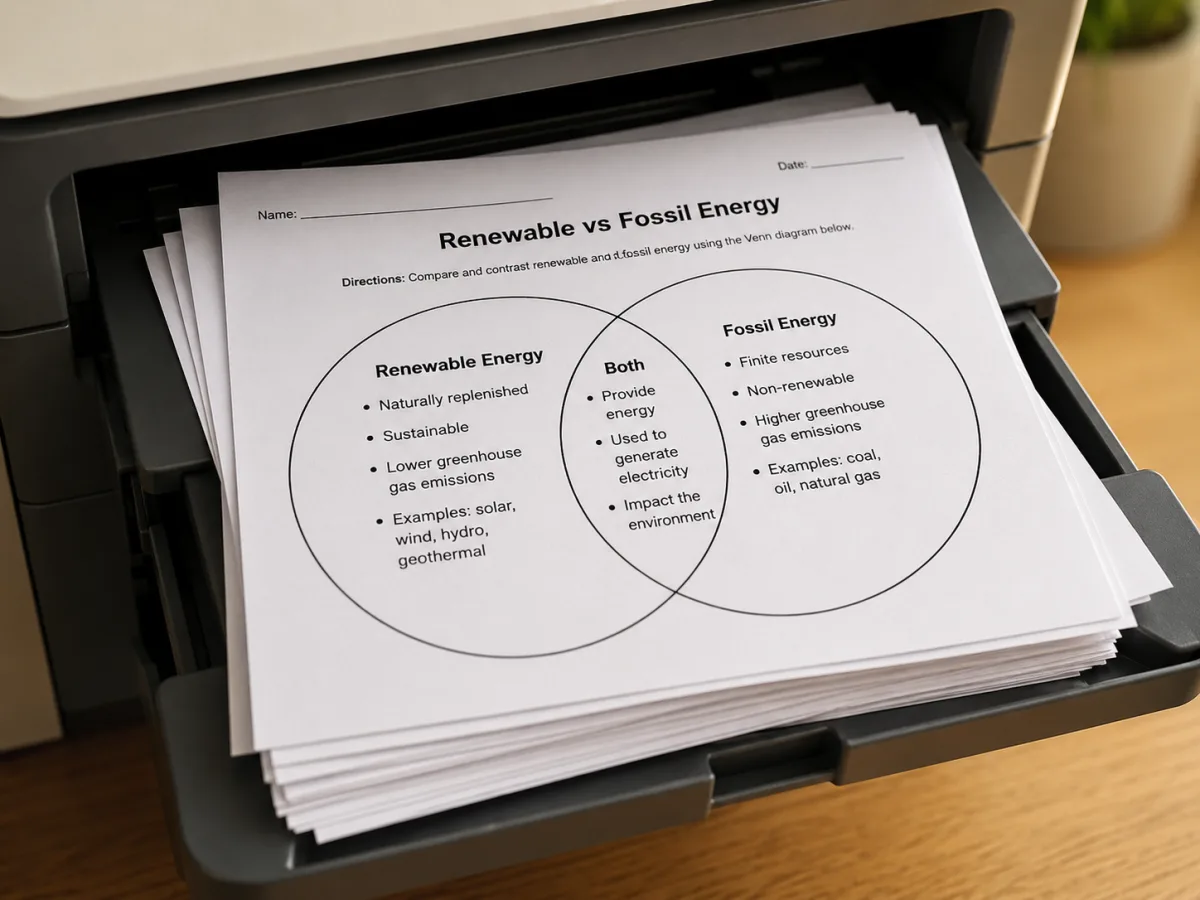
Download the finished diagram as a scalable SVG for a slide deck or journal figure, or as a PNG when you just need to drop it into a document or webpage. Both exports match the live preview exactly, so what you see while editing is what ends up in the file — free, with no account required and just a small corner credit, never anything across your content.
Every venn diagram template below was exported straight from this generator — recreate any of them by typing your own categories into the editor above.
The default two-circle example: what belongs to one book, what belongs to the other, and what both share in the overlap — the layout most reading and writing assignments ask for.
Three labeled number sets with every combination filled in, down to the single region where all three overlap — a common way to illustrate set theory and the intersection symbol in a math class.
Personality traits, motivations, and shared qualities for two characters from the same story, laid out so students can see what makes each character distinct and what they have in common.
Three biological groups plotted against shared traits — habitat, diet, reproduction — showing which organisms fall into more than one category at once, a layout common in life-science classification exercises.
From a blank canvas to a downloadable diagram, here is what building a Venn diagram in this generator looks like, without touching a drawing tool or nudging a single circle by hand.
Start with two circles for a simple comparison, or three when you need to show every combination among three categories — you can switch later without losing your title.
Give each circle a label and, if you want, a custom color. The color fills the circle at low opacity, so overlapping sets blend visibly where they share items.
Type one item per line into each region's text box, including the overlaps — the generator wraps long entries and keeps every list centered inside its own space.
Check the live preview as you edit, then download a clean SVG for editing later or a PNG ready to paste into a slide, document, or webpage.
Both use overlapping shapes to compare sets, but they answer different questions, and it's easy to reach for the wrong one — this generator draws Venn diagrams, where every possible overlap is shown even if it happens to be empty.
Straight answers to what people usually ask before or while building a Venn diagram.
Pick 2 or 3 circles, fill in each region, and download a free Venn diagram as SVG or PNG, right from your browser.