

Enter the numbers from your systematic review. The PRISMA 2020 flow diagram updates live — download it as SVG or PNG, publication-ready.
See how the same PRISMA flow diagram generator adapts to different systematic review and meta-analysis scenarios — from a database-only RCT search to a large-scale review update with tens of thousands of records.
A database-only search for a systematic review of RCTs: thousands of records identified from databases, no trial registers searched, then narrowed through deduplication, screening, and eligibility assessment down to the studies included.
A systematic review that searches both databases and trial registers reports the two record counts side by side at the identification stage, exactly as the official PRISMA 2020 template allows, before they merge into one screening pipeline.
A mid-sized meta-analysis of clinical trials, tracing a few thousand identified records down to a few dozen studies included in the quantitative synthesis, with every exclusion step accounted for along the way.
An updated large-scale review re-runs the search and identifies tens of thousands of new records, screening them down to over a thousand additional studies included alongside the original review.
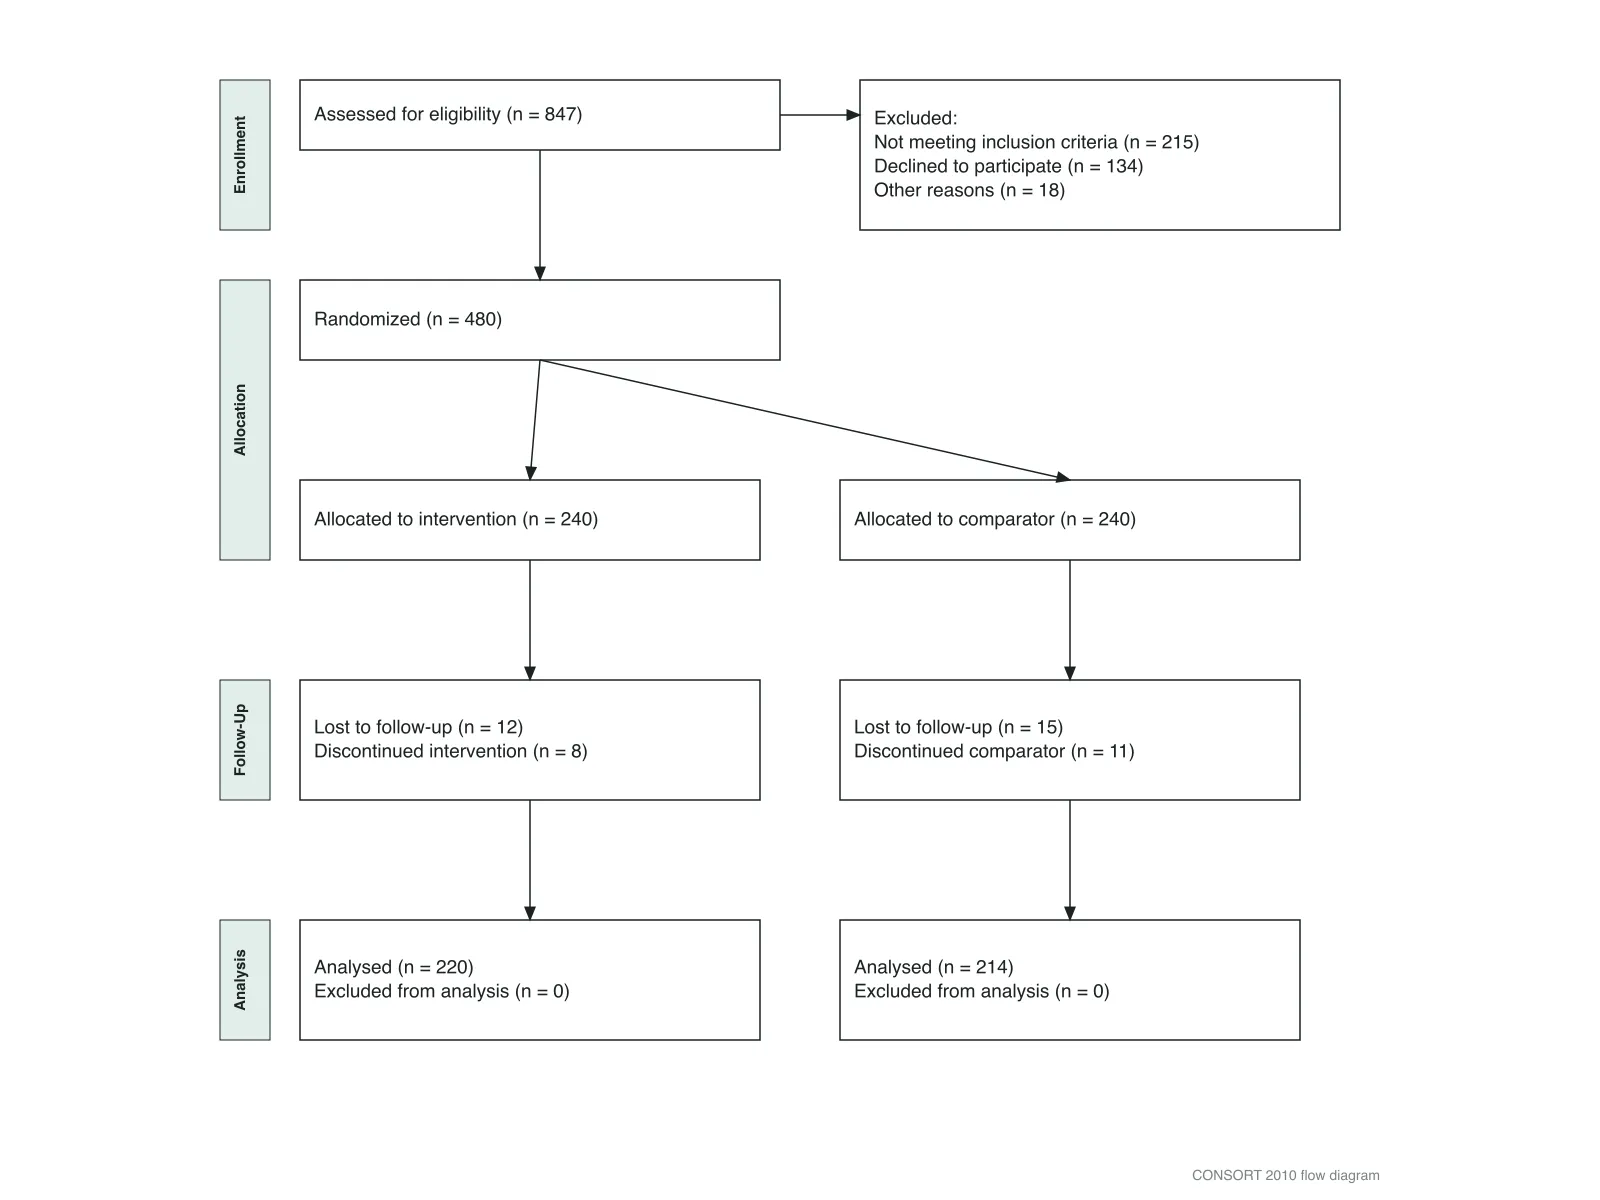
A PRISMA flow diagram is the figure that shows how a systematic review arrived at its final set of studies, recording counts at each stage — identification, screening, and included — so readers can audit the search and selection process for themselves.
PRISMA (Preferred Reporting Items for Systematic Reviews and Meta-Analyses) sets the current reporting standard, PRISMA 2020. Most health, psychology, and social science journals require a PRISMA 2020 flow diagram, with its exact box wording, as a condition of publication.
This PRISMA flow diagram generator builds that exact figure from the numbers you already have — fill in the counts for each stage and the diagram updates as you type, in the layout reviewers and editors expect to see.
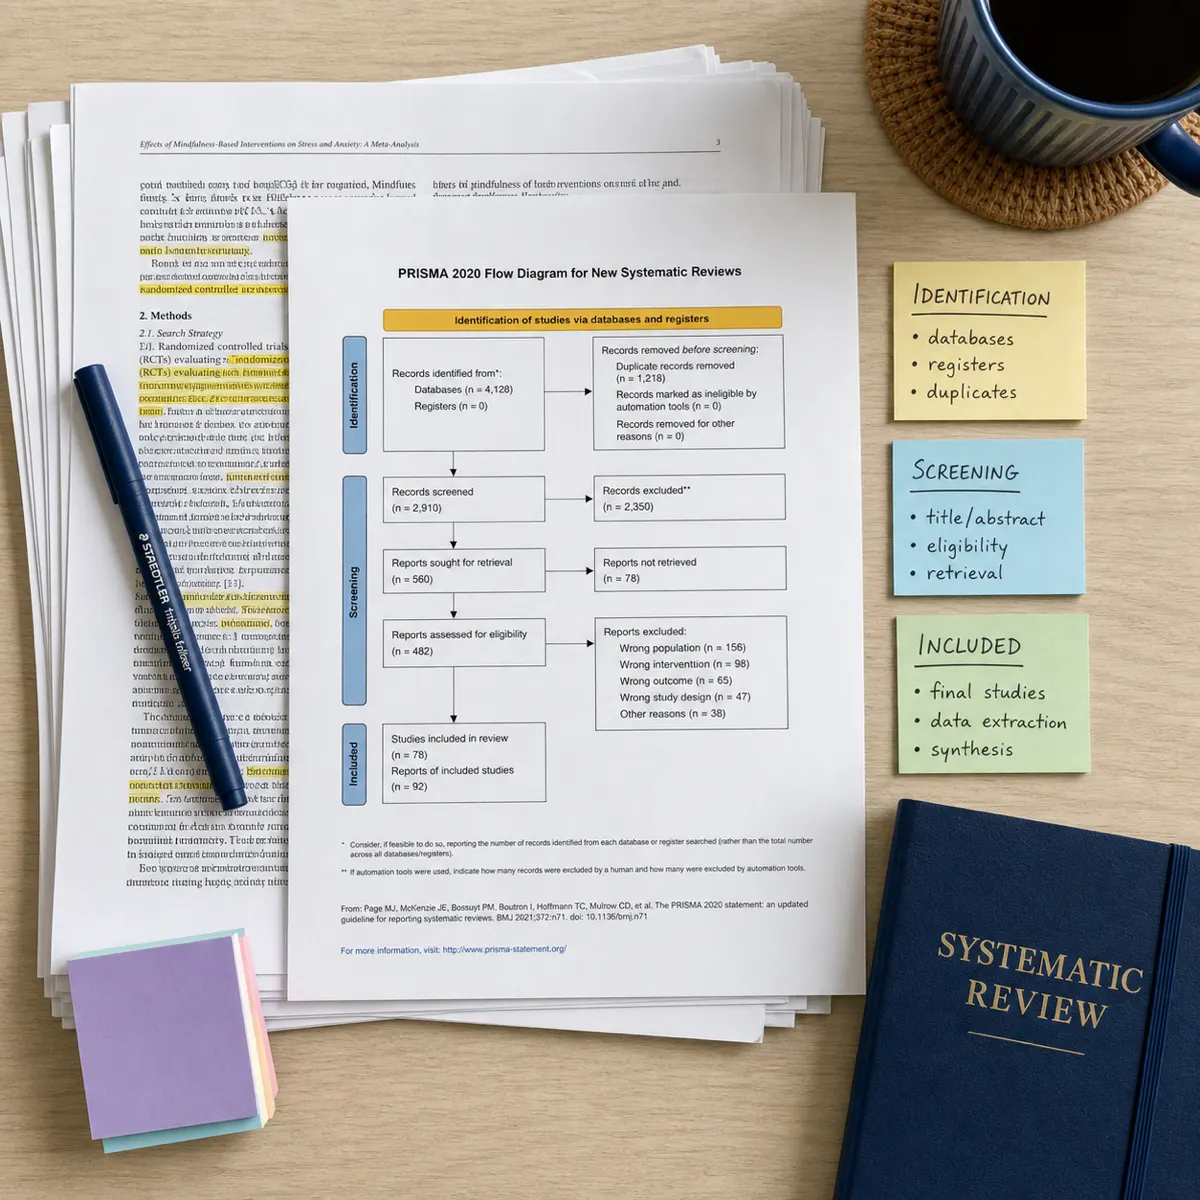
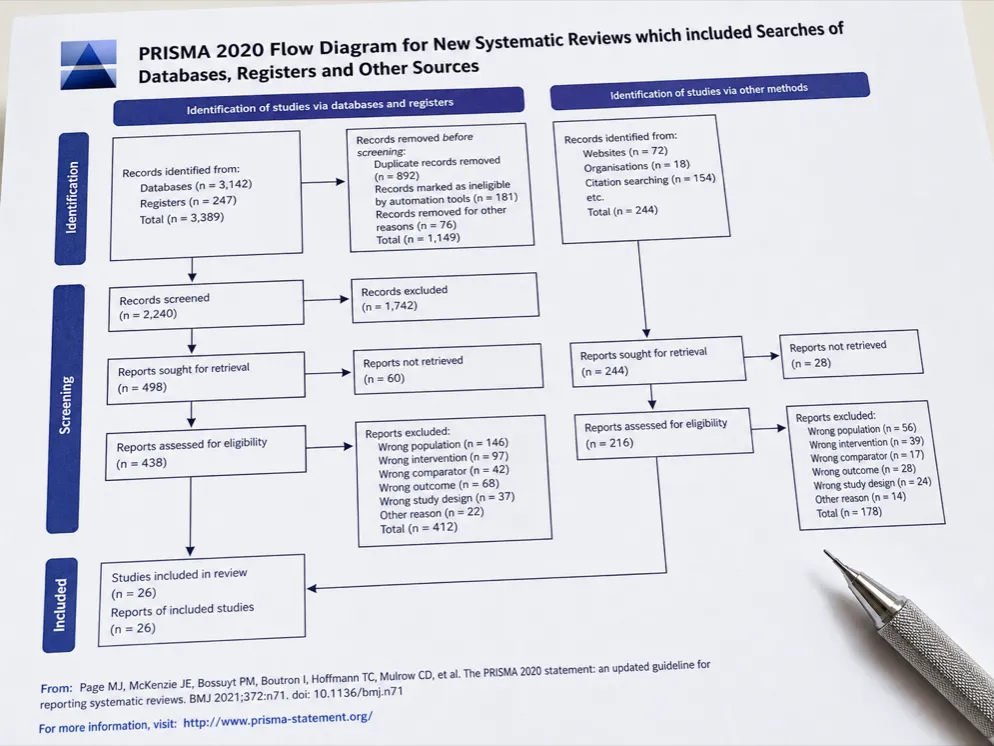
Many tools produce a flowchart that merely looks like PRISMA. This generator reproduces the box labels, stage order, and arrow structure from the official PRISMA 2020 statement box by box, so your figure matches what journal reviewers are trained to check for — no relabeling required before submission.
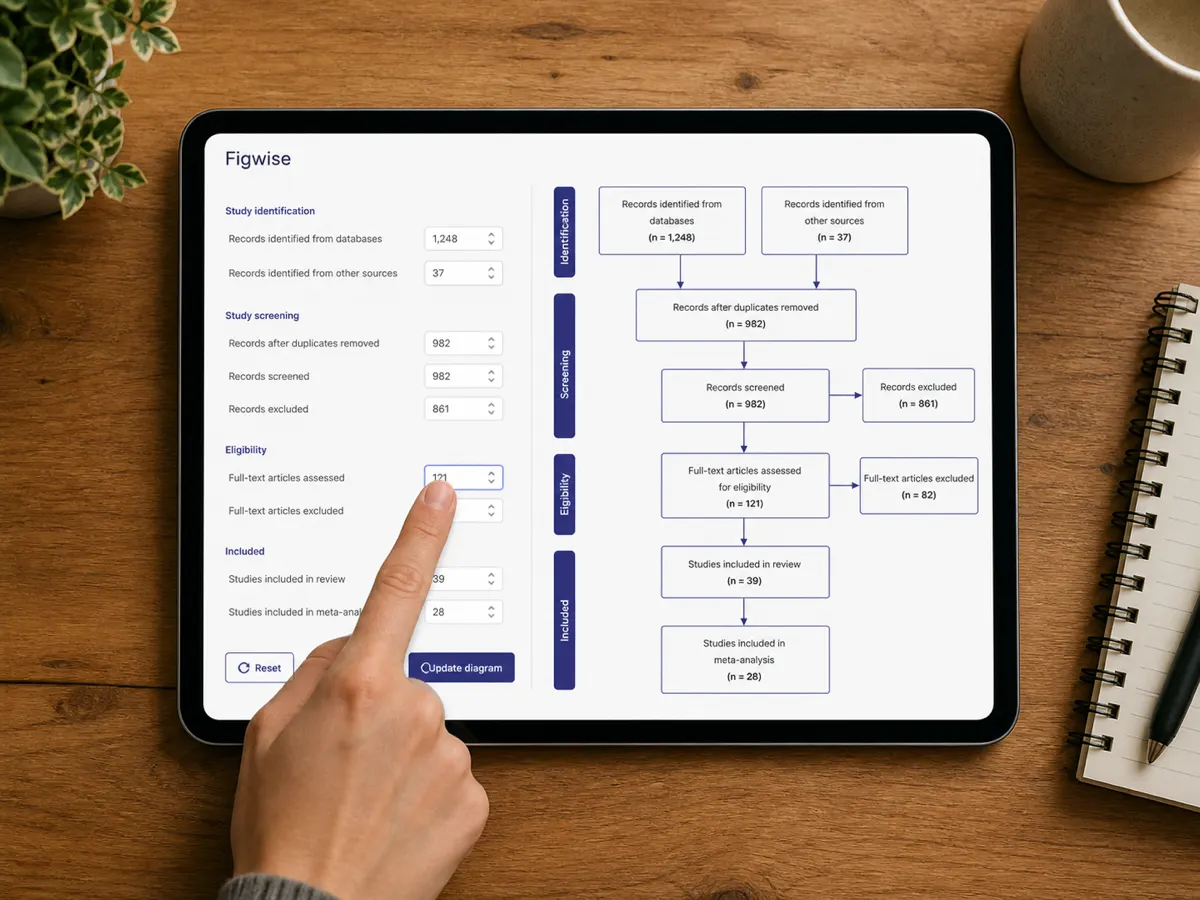
Enter the number of records identified, duplicates removed, records screened, reports excluded with reasons, and studies included, and the diagram redraws immediately. You see the finished figure before you commit to a layout, and you can adjust any count later without starting over.
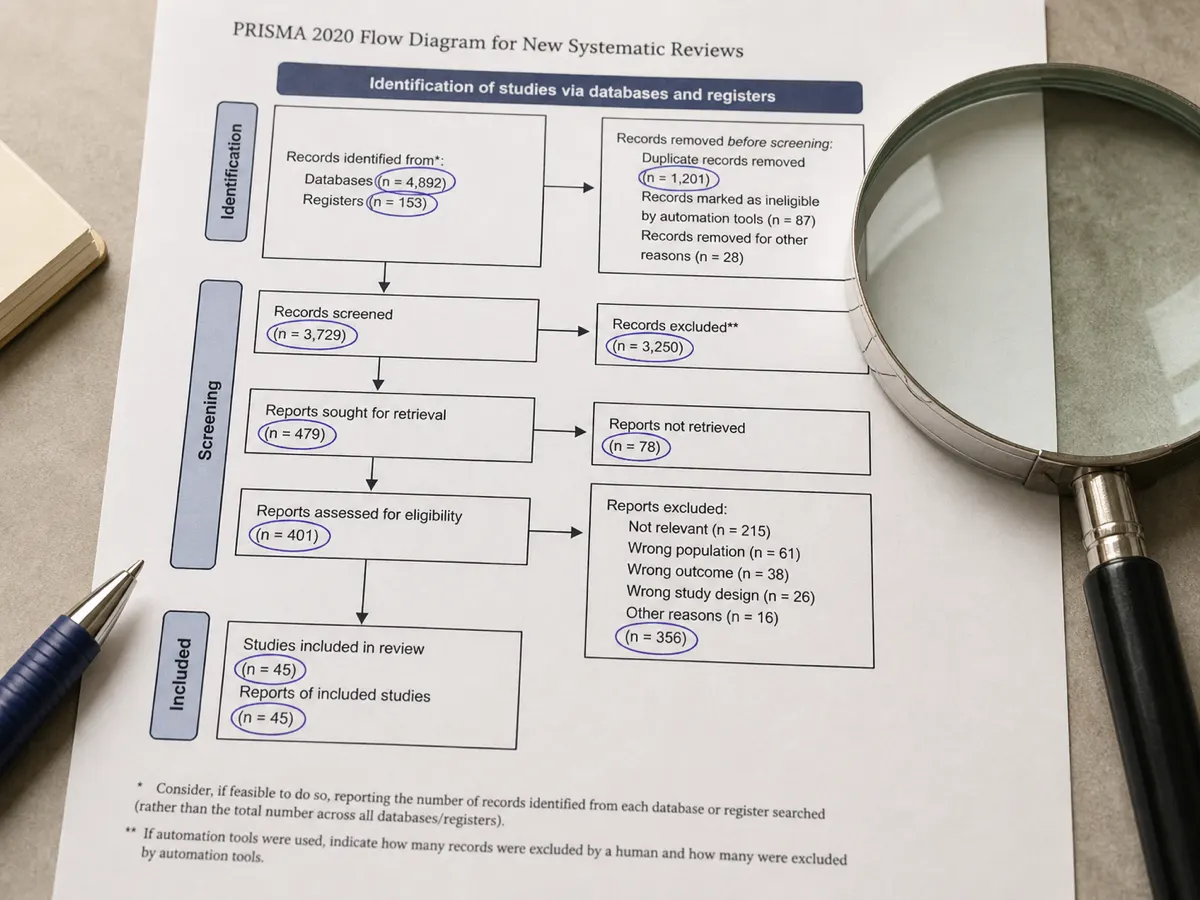
Enter the raw counts for records identified and excluded at each stage, and the generator computes the totals that flow into the next box for you, for example records screened after duplicates are removed, or reports assessed for eligibility after excluding by reason. Fewer arithmetic mistakes make it into the final figure.
Four steps, no design software: gather your search results, enter the counts, review the live preview, and export.
Pull the numbers from your search log and screening records: how many records came from databases, how many from registers, how many duplicates were removed, and how many were screened by title and abstract.
Fill in each stage of the form — identification, screening, and included — including reasons and counts for exclusions at the eligibility stage. The diagram builds itself from these figures.
Compare the generated PRISMA flow diagram against your review protocol or PRISMA-ScR checklist to confirm every excluded record is accounted for and the totals reconcile up and down the diagram.
Download the diagram as SVG for vector-quality print or PNG for online submission systems, then drop it into your manuscript as the required PRISMA flow diagram figure, typically Figure 1.
PRISMA 2020 replaced the 2009 statement and changed the flow diagram in several concrete ways. If your review pre-dates 2020 you may still see the older layout in published papers, but new submissions should use the current version.
Current standard
Superseded
If you were about to download a Word or PowerPoint PRISMA flow diagram template and manually resize boxes, you can skip that step. This generator is the template: the boxes, spacing, and arrow routing are already built to the PRISMA 2020 specification, and you only supply the numbers.
Because the template lives in the browser rather than a file you edit locally, there's nothing to keep in sync between versions of your manuscript. Update a count after a reviewer asks you to re-run a search, and export a fresh SVG or PNG in the same PRISMA 2020 layout.
Everything researchers ask before using a PRISMA flow diagram generator for the first time.
Enter your numbers above and download a publication-ready PRISMA 2020 flow diagram in SVG or PNG — free, no signup.