Nitrogen Cycle Diagram: Fixation to Denitrification
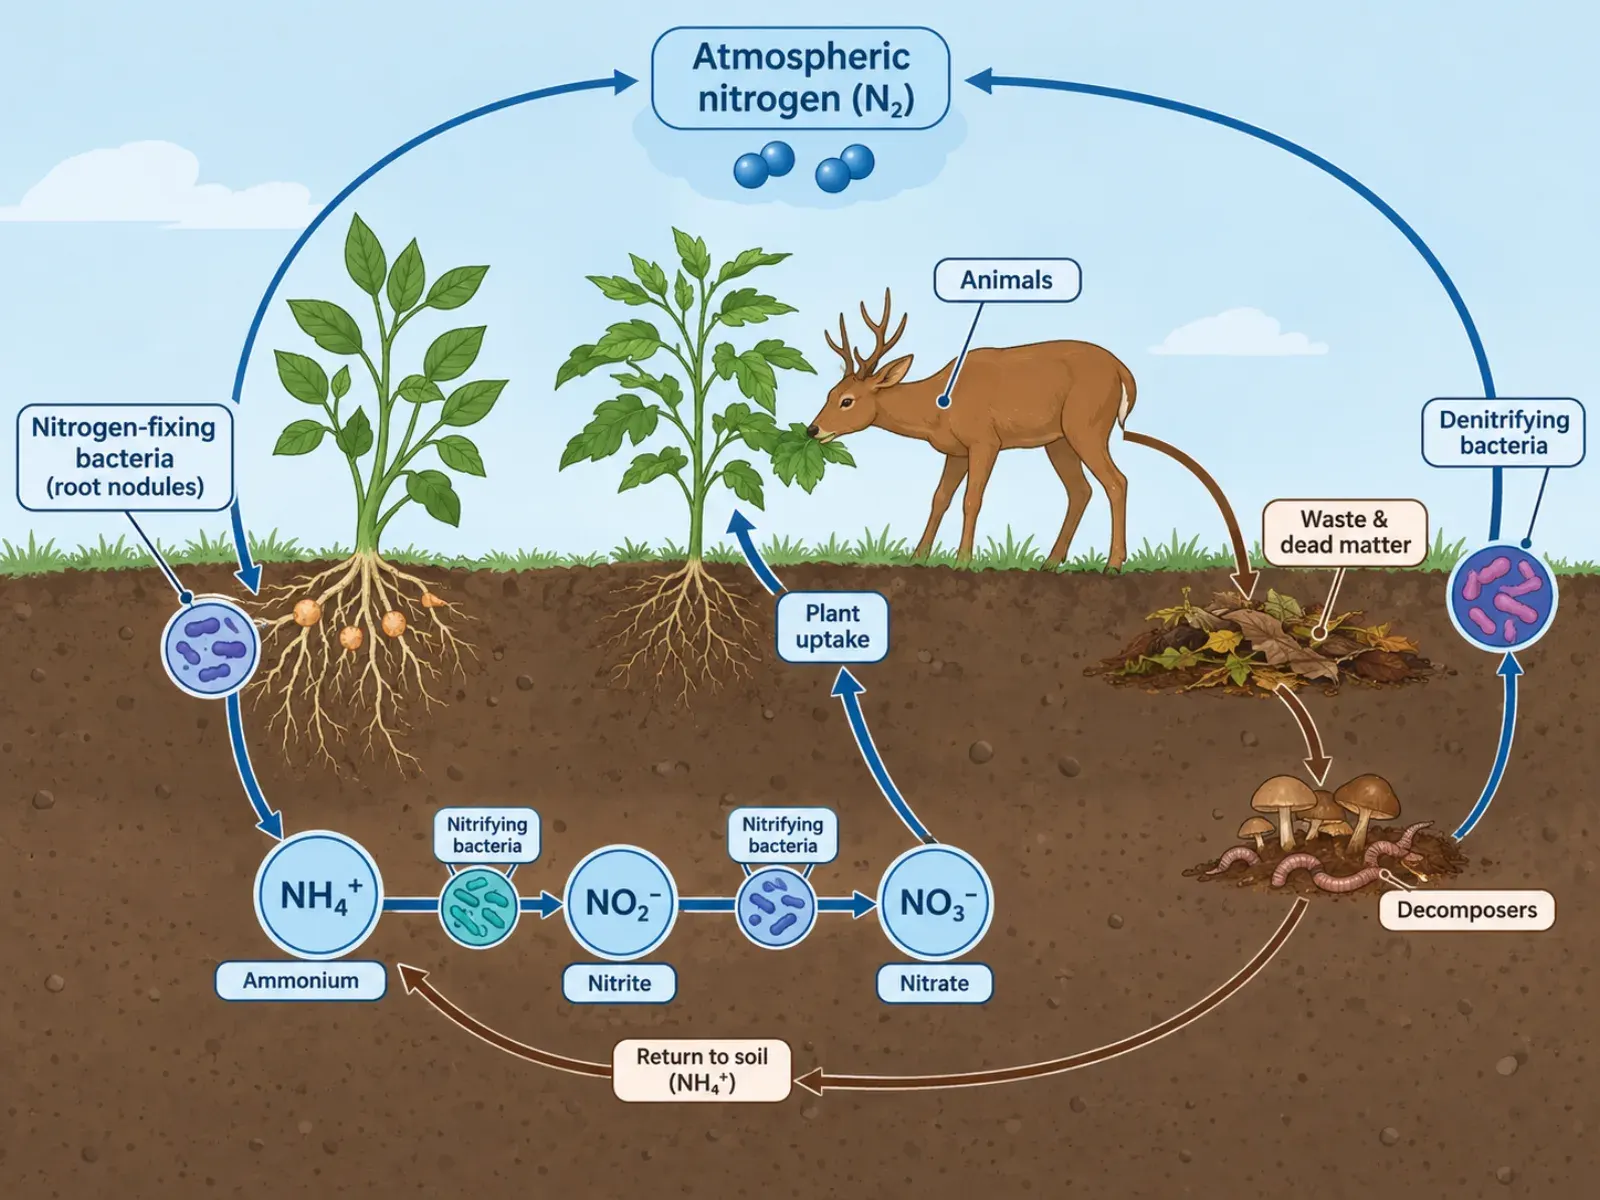
A nitrogen cycle diagram traces how nitrogen moves between the atmosphere, soil, and living organisms, converting between chemical forms at each stage through the action of specific bacteria. Because nitrogen gas makes up most of the atmosphere but is unusable to nearly all organisms in that form, a nitrogen cycle diagram exists to show the series of conversions required before nitrogen can support life, and how it eventually returns to the air to begin again. Reading it means following one nitrogen atom through five distinct transformations rather than treating the cycle as a single vague loop.
What the Nitrogen Cycle Diagram Shows
At its center, the diagram shows nitrogen shifting between an unusable atmospheric form and a series of usable, soil-bound forms, driven almost entirely by bacteria rather than physical or chemical processes alone. This distinguishes the nitrogen cycle diagram from many other ecological cycles: nearly every arrow in the diagram represents a specific bacterial process, not a passive physical change like evaporation or precipitation. The diagram's overall shape is circular because nitrogen is conserved — atoms move between reservoirs (atmosphere, soil, living tissue) but the total amount of nitrogen on Earth stays constant.
The Labeled Processes of a Nitrogen Cycle Diagram
- Nitrogen fixation — converts atmospheric N2 gas into ammonia or ammonium, carried out mainly by nitrogen-fixing bacteria such as Rhizobium living in the root nodules of legumes, with a smaller contribution from lightning.
- Nitrification — a two-step bacterial process where nitrifying bacteria first convert ammonium into nitrite, and a second group of bacteria convert that nitrite into nitrate, the form most plants absorb.
- Assimilation — plants take up nitrate or ammonium from the soil and build it into amino acids and nucleic acids; animals then obtain nitrogen by eating plants or other animals.
- Ammonification — decomposers break down dead organisms and waste products, releasing the nitrogen they contain back into the soil as ammonium.
- Denitrification — denitrifying bacteria, active in low-oxygen conditions such as waterlogged soil, convert nitrate back into nitrogen gas, returning it to the atmosphere and closing the cycle.
How to Interpret the Nitrogen Cycle Diagram: Tracing Nitrogen Between Forms
Read a nitrogen cycle diagram by following one nitrogen atom's journey rather than scanning the arrows out of order: start with nitrogen fixation pulling N2 from the atmosphere into the soil as ammonium, then trace nitrification lifting that ammonium up into nitrite and then nitrate, then assimilation pulling nitrate into plant and animal tissue, then ammonification releasing it back into the soil when organisms die or excrete waste, and finally denitrification returning nitrate to the atmosphere as gas. The arrows between soil and atmosphere are the two "exit and entry" points of the whole cycle — fixation brings nitrogen in, denitrification sends it back out — while the arrows entirely within the soil and biosphere (nitrification, assimilation, ammonification) recycle nitrogen among living things without any atmospheric exchange. Diagrams often use color or arrow direction to separate these atmospheric-exchange steps from the internal recycling steps, and reading that separation correctly clarifies why the cycle needs bacteria at almost every stage.
Common Mistakes When Reading or Drawing a Nitrogen Cycle Diagram
The most common mistake is assuming plants and animals can use atmospheric nitrogen gas directly — they cannot, since N2's triple bond is too stable to be broken down by ordinary metabolism, which is exactly why nitrogen fixation by bacteria is a required first step. A second frequent error is confusing nitrification with denitrification because the names sound so similar: nitrification builds ammonium up into nitrate (a usable form), while denitrification tears nitrate back down into nitrogen gas (an unusable form) — they run in opposite directions and are carried out by entirely different bacteria. A third common mistake is leaving decomposers out of the diagram entirely, which breaks the cycle: without ammonification returning nitrogen from dead matter to the soil, the cycle has no way to recycle nitrogen already locked in living tissue.
Nitrogen Cycle vs. Krebs Cycle Diagrams
Both diagrams use the word "cycle," but they describe processes operating at entirely different scales. A nitrogen cycle diagram operates across an entire ecosystem, tracking one element as it moves between the atmosphere, soil, and countless organisms over days to years. A Krebs cycle diagram, by contrast, operates inside a single mitochondrion, extracting energy from one molecule of acetyl-CoA in a matter of seconds. Beyond the shared name, the two processes are unrelated — one is an ecological nutrient cycle, the other a cellular energy pathway — and confusing them usually comes from assuming any biological "cycle" must work at a similar scale, when in fact scale is exactly where these two diagrams diverge.