Krebs Cycle Diagram: Steps and Products Explained
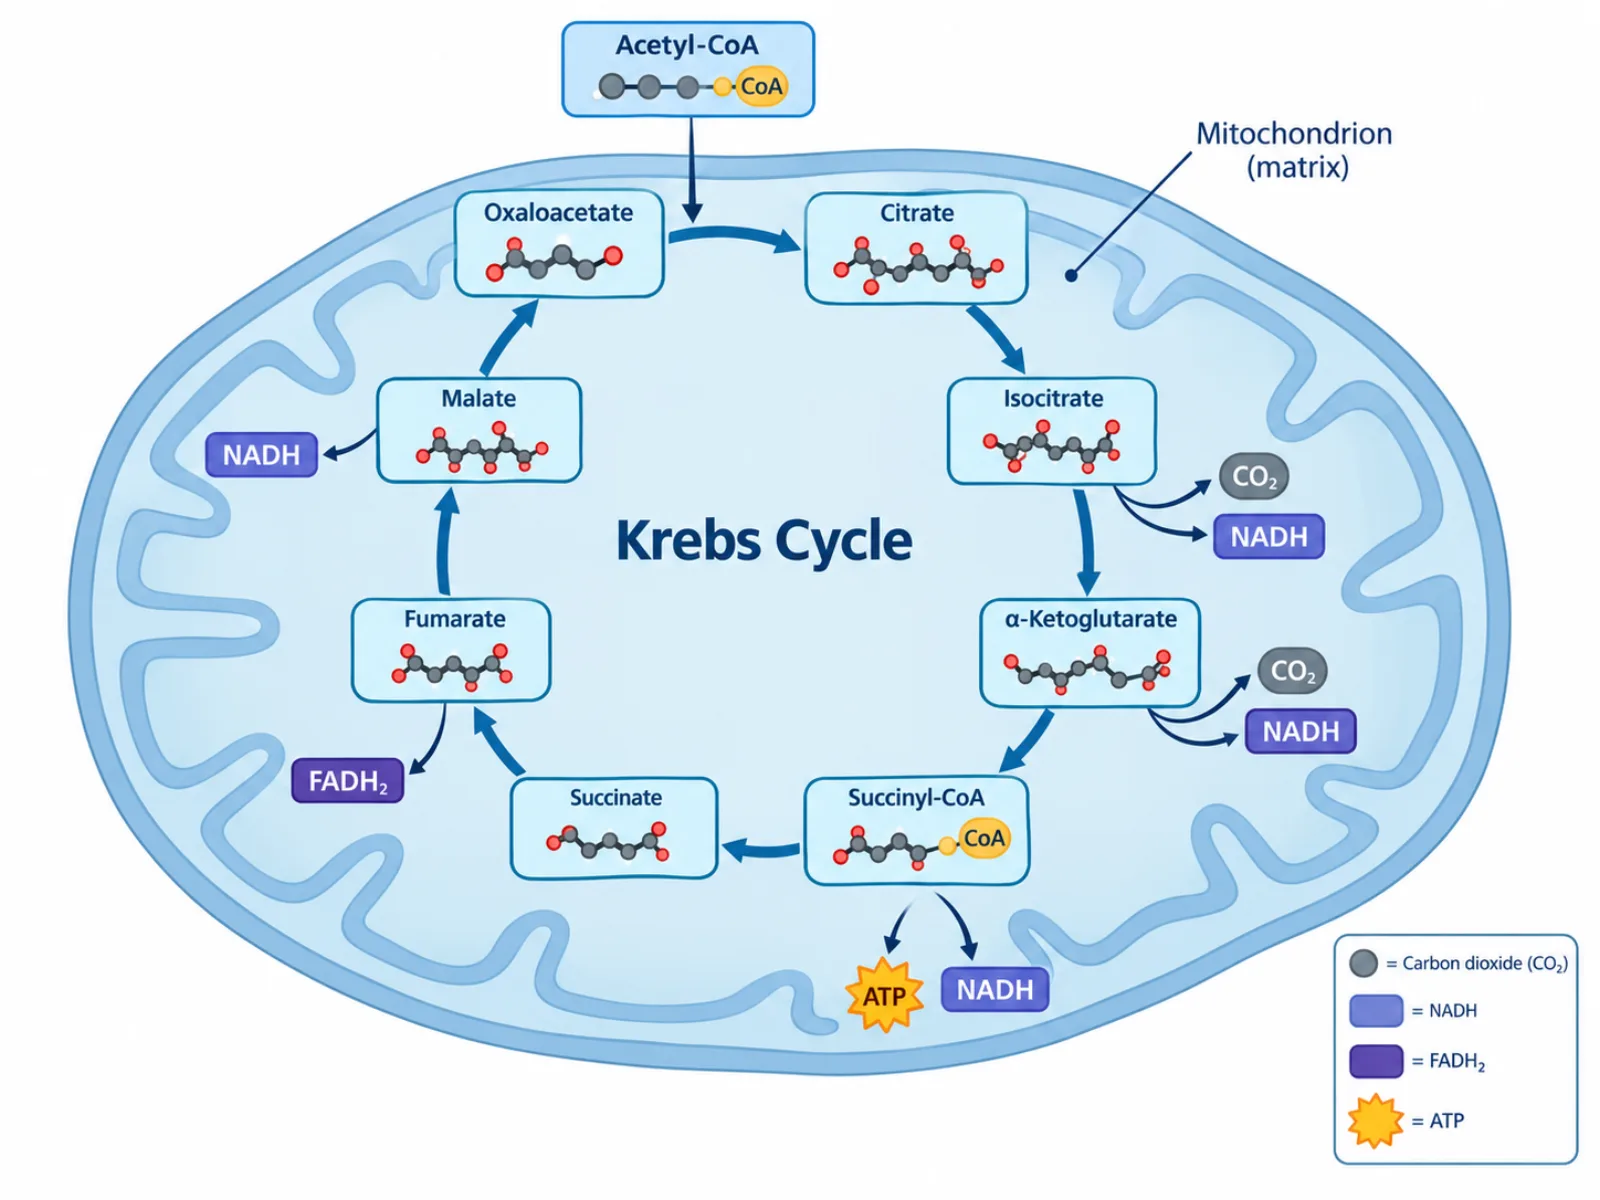
A Krebs cycle diagram shows how a cell extracts usable energy from a single molecule entering the mitochondrial matrix, converting carbon and chemical bonds into carbon dioxide, high-energy electron carriers, and a small amount of ATP. Unlike a straight-line pathway, a Krebs cycle diagram is drawn as a closed loop because the molecule that starts the cycle is regenerated at the end, allowing the same cycle to run repeatedly as long as fuel keeps arriving. Reading the diagram correctly means tracking both the circular regeneration of one key molecule and the linear output of electron carriers released along the way.
What the Krebs Cycle Diagram Shows
The diagram depicts a sequence of chemical conversions taking place entirely within the mitochondrial matrix, where a two-carbon molecule is combined with a four-carbon molecule to eventually be broken down, releasing carbon dioxide and capturing energy in electron carriers at several points around the loop. The circular layout is not just a stylistic choice — it reflects the fact that the four-carbon molecule consumed at the start is chemically regenerated by the end, allowing the cycle to accept a new fuel molecule immediately rather than needing to be rebuilt from scratch each time.
The Labeled Steps of a Krebs Cycle Diagram
- Acetyl-CoA entry — a 2-carbon molecule made from pyruvate (the product of glycolysis) enters the cycle and combines with oxaloacetate.
- Oxaloacetate — a 4-carbon molecule that combines with acetyl-CoA to form citrate, and is regenerated at the end of the cycle to start the process again.
- Citrate formation — the combination of acetyl-CoA and oxaloacetate produces citrate, a 6-carbon molecule, at the beginning of the loop.
- Intermediate conversions — citrate passes through a series of intermediate molecules, each conversion releasing a carbon atom as CO2 or extracting high-energy electrons.
- CO2 release — across the full cycle, two carbon atoms are released as carbon dioxide, matching the two carbons that entered as acetyl-CoA.
- NADH and FADH2 production — high-energy electrons captured during the intermediate conversions are carried by NADH (3 per turn) and FADH2 (1 per turn) to the electron transport chain.
- ATP/GTP production — one turn of the cycle directly generates 1 molecule of ATP or GTP through substrate-level phosphorylation.
- Oxaloacetate regeneration — the final conversion in the loop restores oxaloacetate, completing the cycle and allowing it to accept another acetyl-CoA.
How to Interpret the Krebs Cycle Diagram: Following One Turn of the Ring
Read a Krebs cycle diagram by starting at the acetyl-CoA entry point and following the loop clockwise (as most textbook diagrams draw it) through each intermediate molecule, noting where CO2 branches off and where NADH or FADH2 is generated. The arrows around the ring represent one continuous sequence of chemical conversions, not several separate reactions, and the ring closes precisely because oxaloacetate — consumed at the very first step — is regenerated at the very last one. Because glycolysis produces two pyruvate molecules from each glucose molecule, and each pyruvate is converted into one acetyl-CoA, the diagram should be understood as running twice for every glucose molecule that enters cellular respiration — a detail easy to miss when looking at a single pass around the loop.
Common Mistakes When Reading or Drawing a Krebs Cycle Diagram
The most common mistake is assuming the Krebs cycle itself produces most of a cell's ATP; in reality it directly generates only 1 ATP (or GTP) per turn, and its real contribution is the NADH and FADH2 it hands off to the electron transport chain, where the large majority of ATP is actually produced. A second frequent error is forgetting that the cycle turns twice per glucose molecule, not once, since glycolysis yields two pyruvate molecules and therefore two acetyl-CoA molecules entering the matrix. A third common mistake is misplacing the cycle in the cytoplasm; the Krebs cycle occurs specifically in the mitochondrial matrix, distinct from glycolysis, which takes place in the cytoplasm before pyruvate is transported into the mitochondrion.
Krebs Cycle vs. Nitrogen Cycle Diagrams
Despite sharing the word "cycle," a Krebs cycle diagram and a nitrogen cycle diagram describe processes at completely different scales. The Krebs cycle extracts energy from a single molecule inside one mitochondrion, completing a full turn in seconds as part of cellular respiration. A nitrogen cycle diagram, by contrast, tracks an element moving through an entire ecosystem — atmosphere, soil, and living organisms — over a much longer timescale. The Krebs cycle is best understood in context as the second of three stages in cellular respiration, following glycolysis and preceding the electron transport chain, where the NADH and FADH2 it produces are finally converted into the majority of the cell's usable ATP.