

List who eats whom, one line at a time, and this food web maker sorts every species into its trophic level and draws a food web diagram with arrows pointing toward each predator.
Four food web diagrams built with this food web maker, each showing how the same layering logic handles a different ecosystem and a different teaching goal.
Algae and duckweed anchor the producer row; tadpoles, snails, and mayfly larvae feed on them; frogs, fish, and dragonfly nymphs sit above as consumers, with a heron closing the web as the top predator.
Grass supports grasshoppers, mice, and rabbits; snakes and hawks split into two predator branches instead of one straight chain, which is exactly the shape a food chain diagram cannot show on its own.
Oak leaves feed caterpillars and deer; owls and foxes prey on smaller animals above them, while fungi and bacteria sit in a separate decomposer row that recycles dead matter from every level back into the soil.
The same marine data drawn twice: a classic energy pyramid on one side, showing how little energy survives each transfer, and the branching trophic web on the other, showing which species actually compete for it.
Four steps from a list of species to an exportable food web diagram — no drawing software, no manual layout.
Write one relationship per line as "Predator eats Prey" — for example, "Hawk eats Snake". Order does not matter; this food web maker rebuilds the hierarchy from the full list.
Add a line like "decomposers: Fungi, Bacteria" to pull those species out of the trophic ladder and into their own row, since they recycle matter from every level rather than occupying one.
Producers land on the bottom row automatically; every other species is placed one level above its longest chain to a producer. Fix any inline error — a self-loop, a floating species, or a missing producer — before continuing.
Download a vector SVG you can relabel for a worksheet or poster, or a 2× PNG ready to paste into a slide deck or lab report.
A food chain diagram and a food web diagram both show who eats whom, but only one of them matches how a real ecosystem actually works.
Multiple interlocking chains, drawn as a branching graph
A single straight line, one species feeding the next
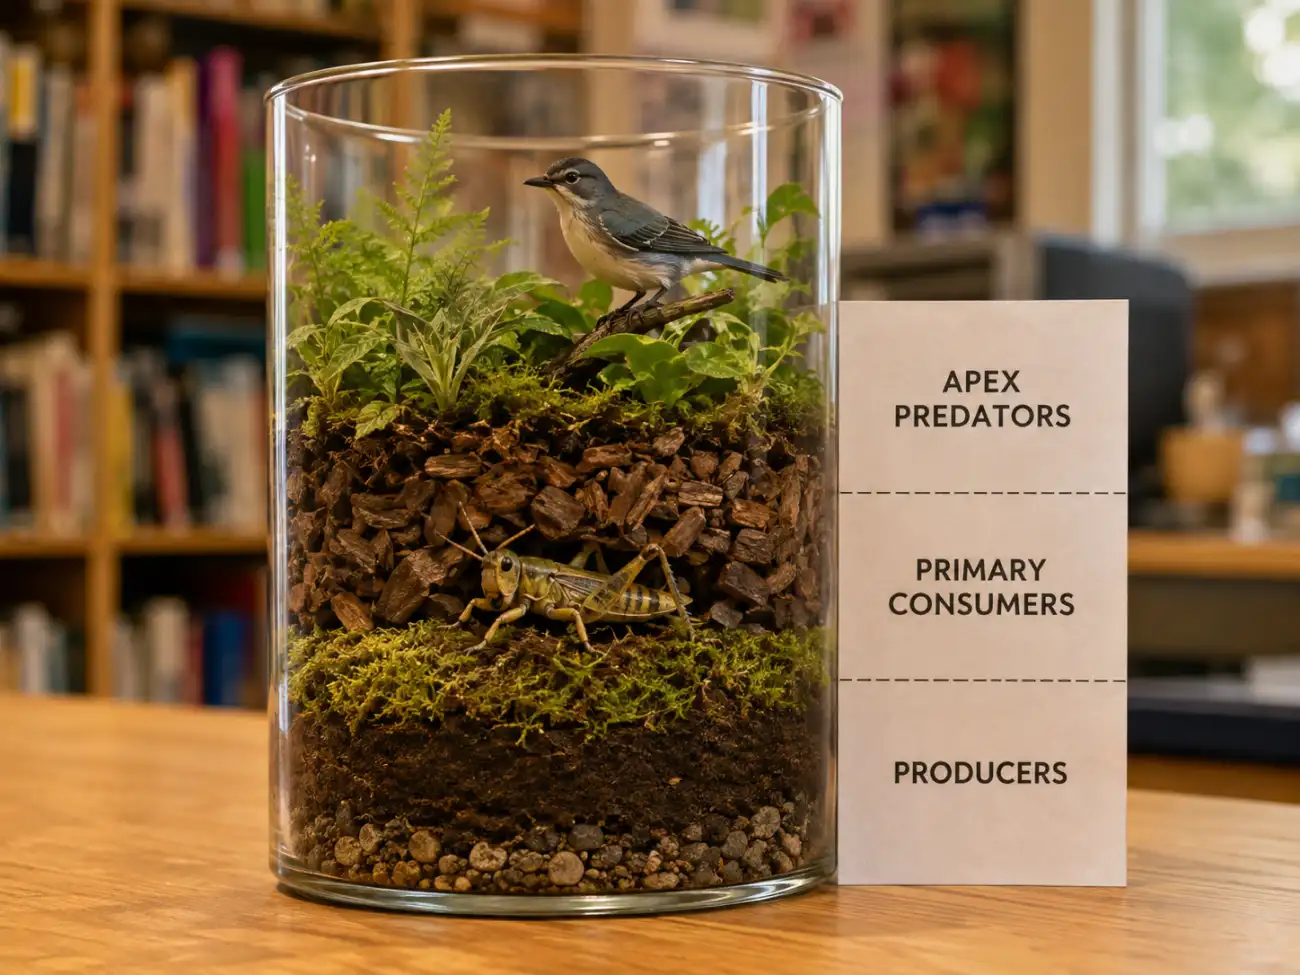
Typing relationships is easy; sorting them into producers, primary consumers, secondary consumers, and apex predators by hand is not. This food web maker computes each species' trophic level as the longest predation path back to a producer, so a species eaten at very different levels still lands in the row matching its highest real dependency.
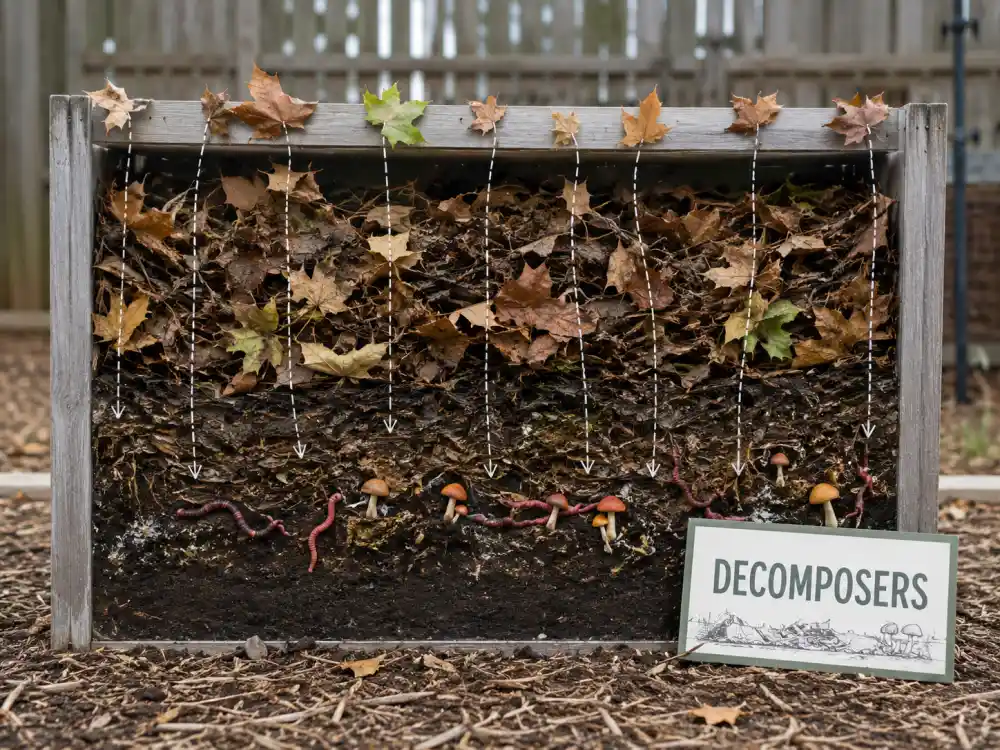
Fungi and bacteria do not fit a single trophic level — they process dead matter arriving from every level above them, not just one. Turn on the decomposer row and this food web maker draws them separately, with dashed arrows summarizing that inflow instead of forcing them into the ladder alongside living predators.

The three mistakes every student makes with a food web diagram — a species that preys on itself, a floating species with no connections, and a graph with no producer at all — each get a specific, line-numbered error instead of a broken or blank diagram, so the fix is obvious.
A food web is a network of feeding relationships within an ecosystem, showing every predator-prey connection at once rather than isolating one path. A food chain diagram picks a single line through that network — grass to rabbit to fox, say — but real animals rarely eat just one thing or get eaten by just one predator, so a food web is the more accurate picture of how energy actually moves through a community.
Trophic level counting works from the bottom up. Producers — plants, algae, and other organisms that make their own energy — sit at level 0 because they do not prey on anything listed. Every other species takes the level one above its longest predation path back to a producer: an omnivore that eats both a producer and a mid-level consumer is placed above the higher of the two, not averaged between them, because that longer path is the one that actually determines how much energy has already been lost to previous transfers.
Arrows point toward the predator because that is the direction energy flows — a rabbit's tissue becomes part of the fox that eats it, not the other way around. Drawing the arrow prey-to-predator, rather than the common reversal, keeps the diagram an energy-flow map instead of a "who attacks whom" chart, and this food web maker follows that convention throughout. It also explains why removing one species rarely stays contained: a predator with several prey can shift to the others, but a prey species with only one predator, or a producer with no substitute, tends to trigger a trophic cascade — the Yellowstone-style chain reaction textbooks cite because a food chain diagram cannot show why it happened, while a food web diagram makes the missing link visible at a glance.

Common questions about food webs, trophic levels, and how to build one with this tool.
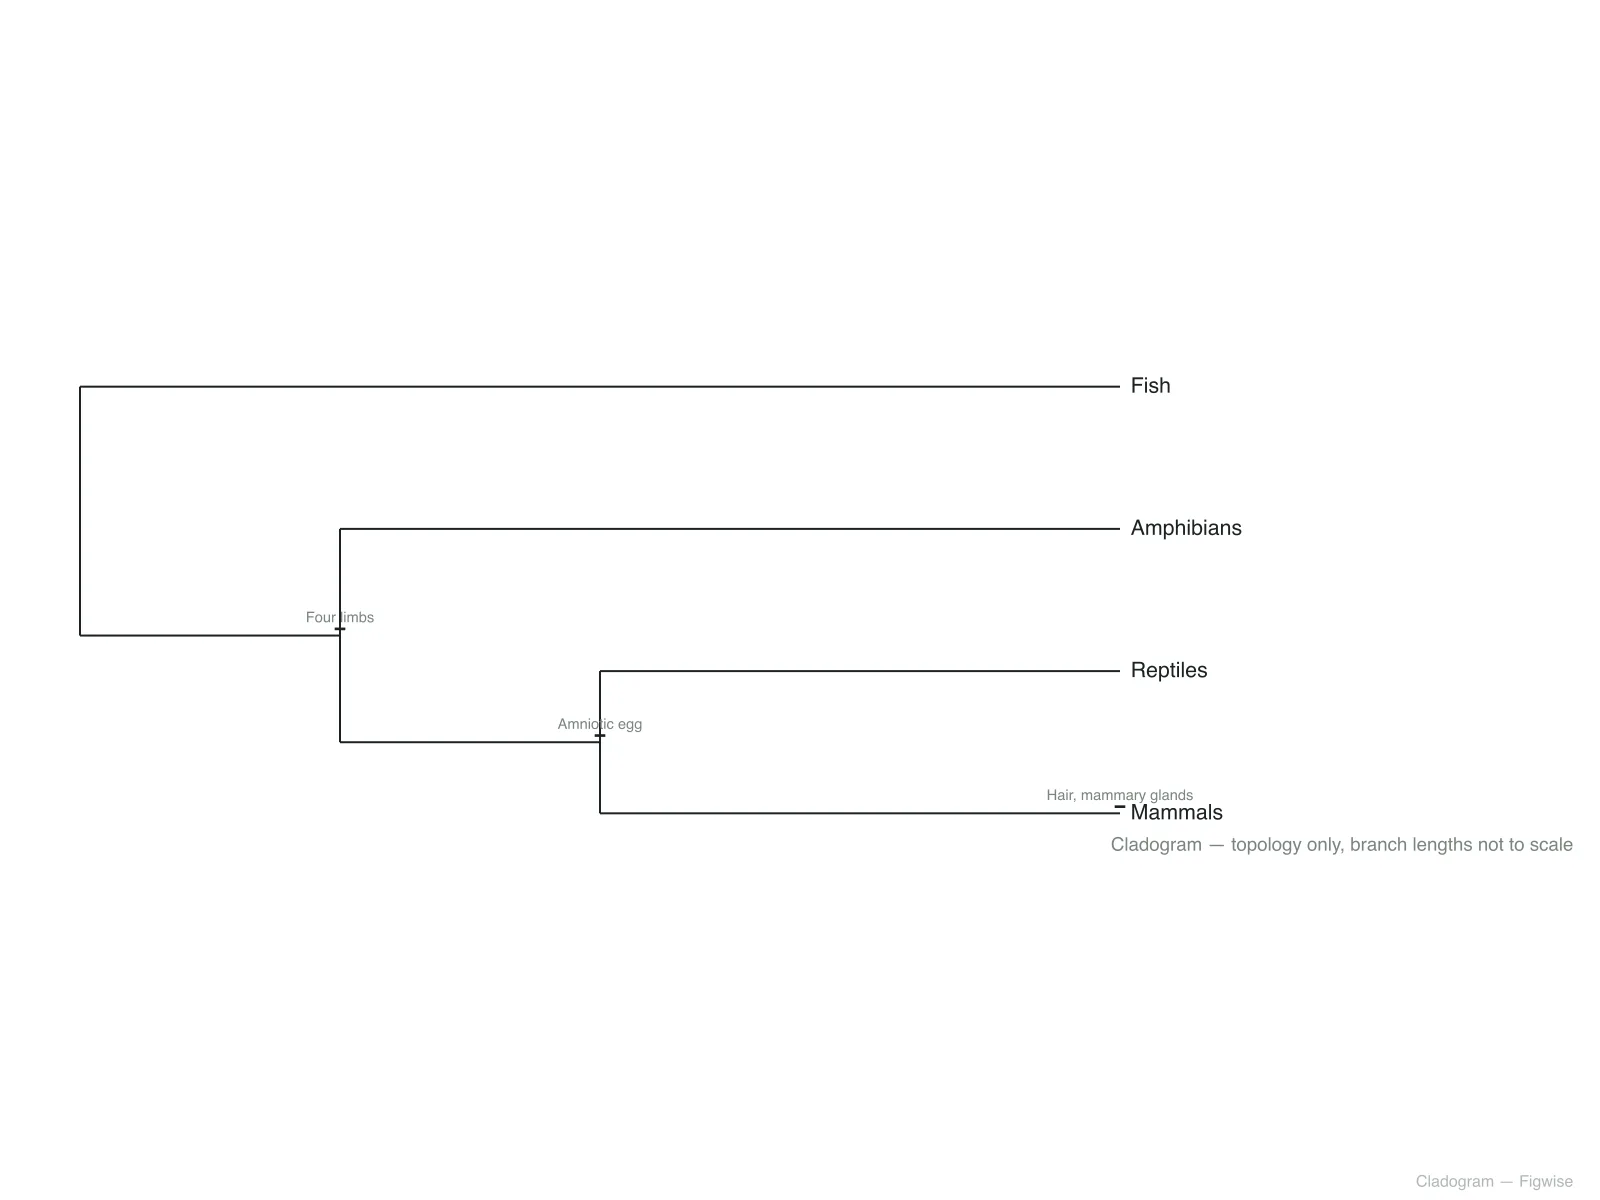
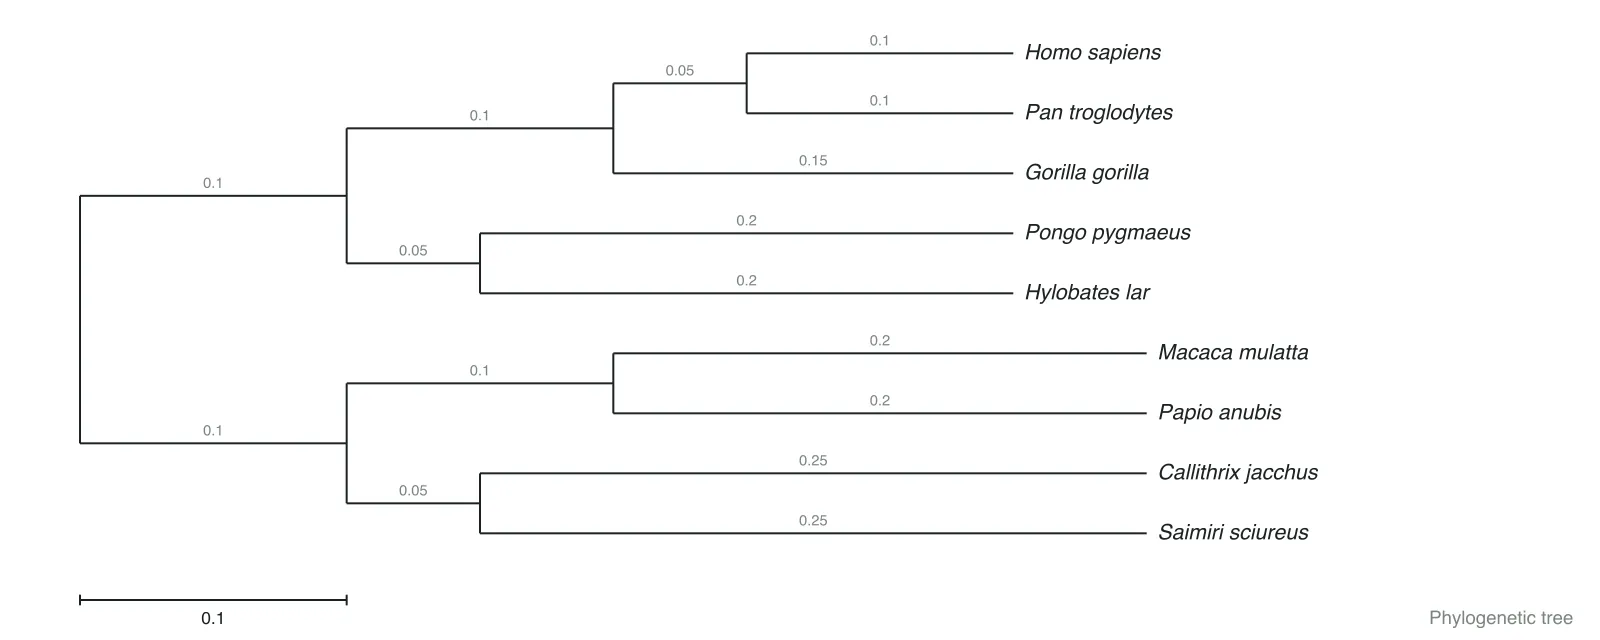
No installation, no manual layout — list who eats whom and download a food web diagram ready for a worksheet or lab report.