

Describe your study — variables, expected relationships — and get a clean conceptual framework diagram. Free to download.
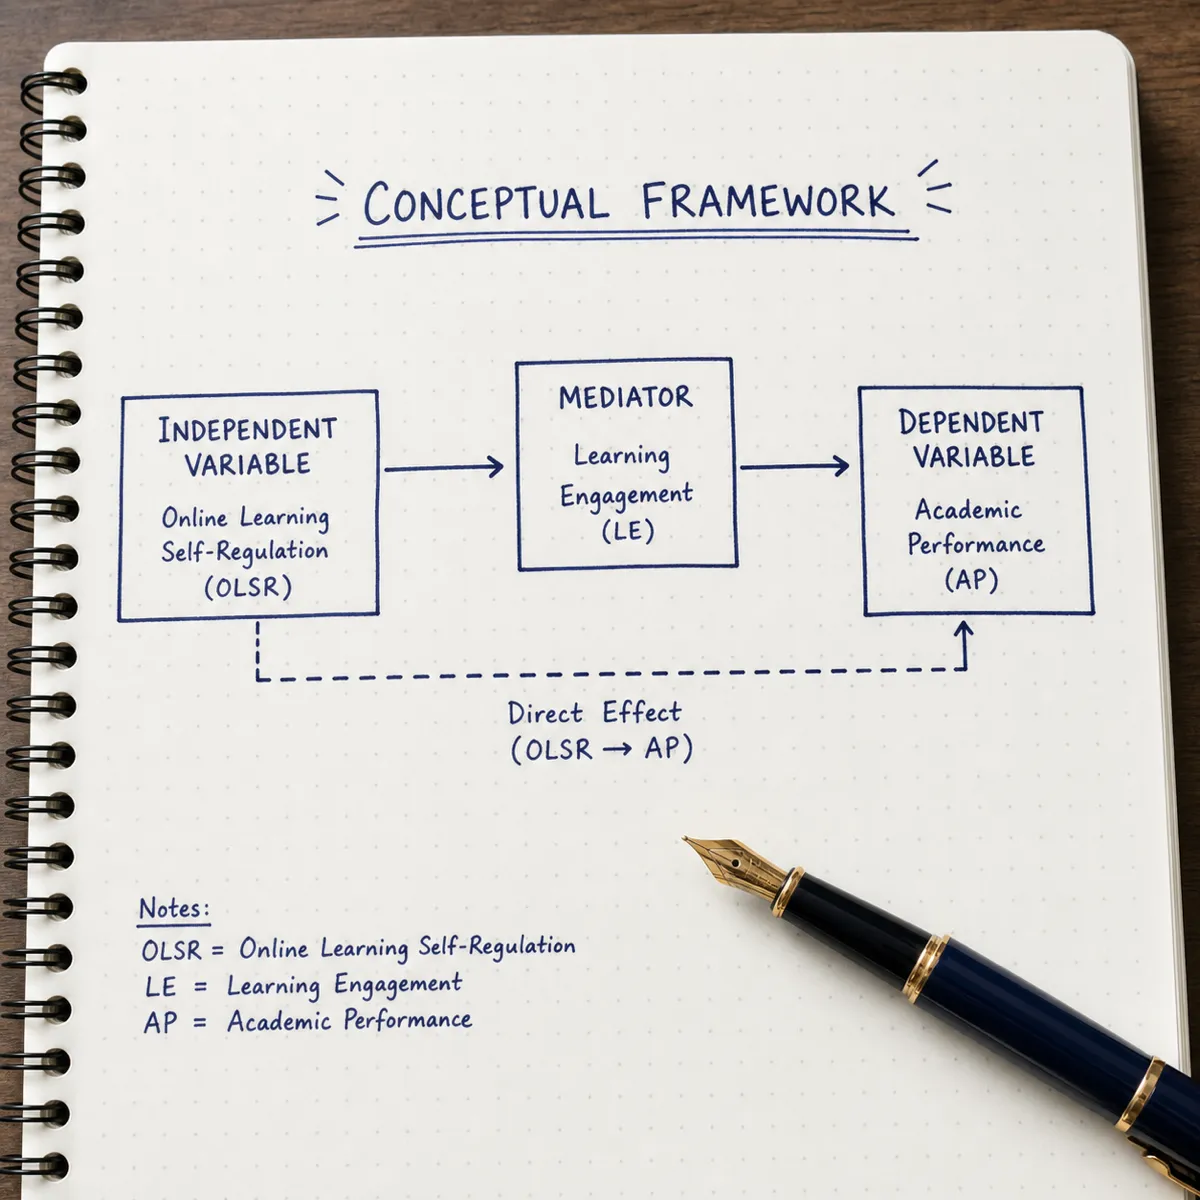
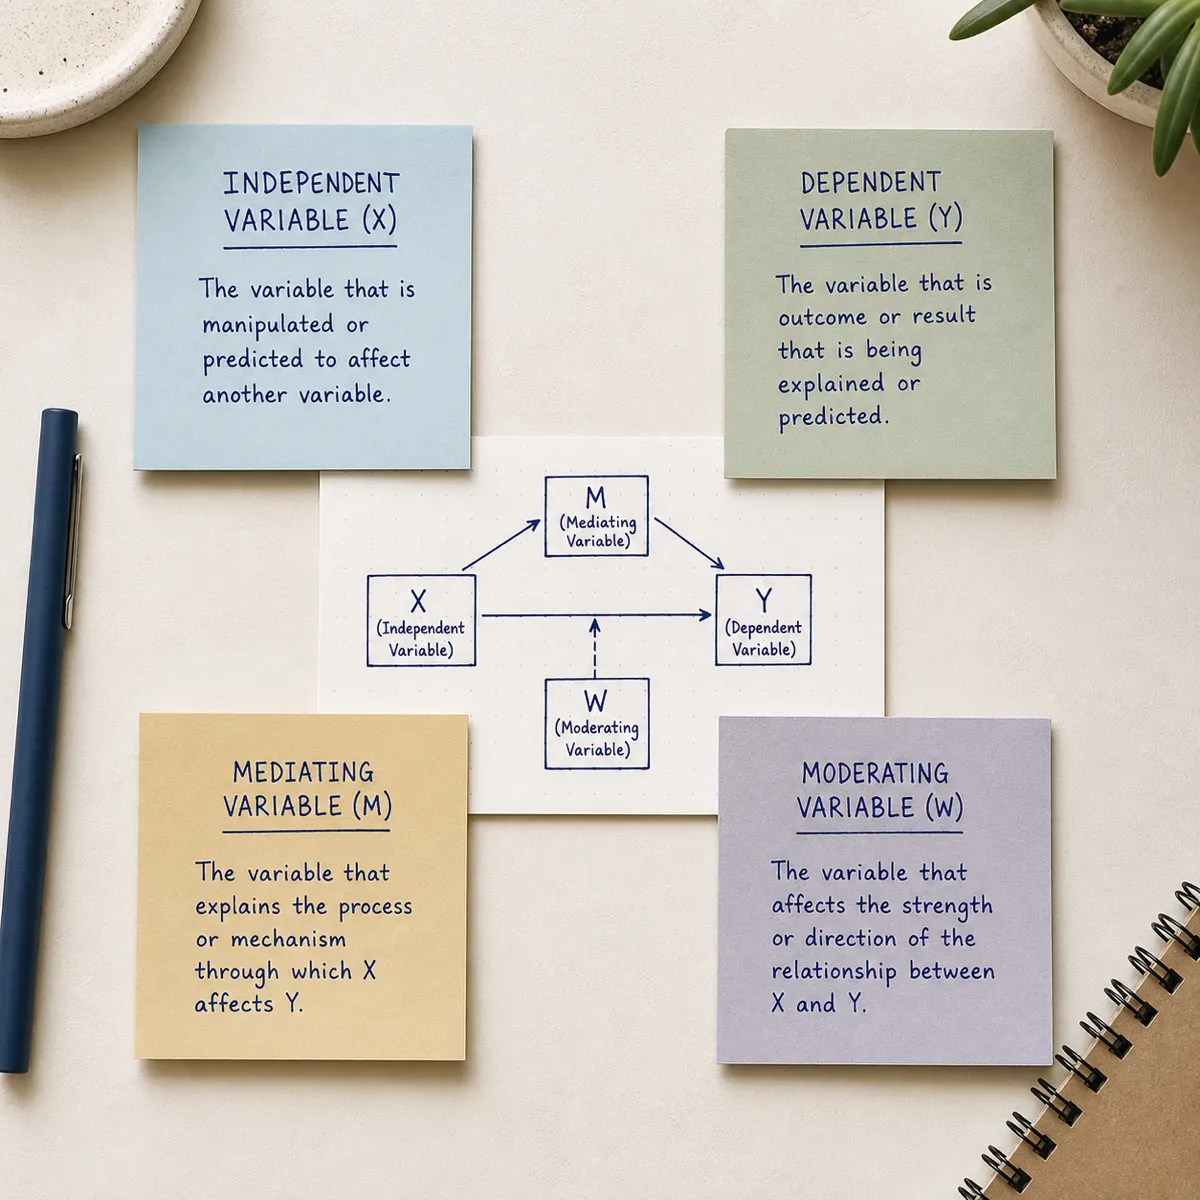
A conceptual framework is a diagram showing the relationships you expect among a study's variables — it sits between broad theory and a testable hypothesis. It turns abstract ideas like "technology adoption" into boxes and arrows, sorting variables into four roles: independent, dependent, mediating, moderating.
You build it after the literature review and before data collection, because it forces you to state which variable causes which, and through what pathway — matching the framework to your research question and hypothesis.
The framework is not the theory itself but your application of it to your study's variables. Papers need this diagram, not the theory text, because reviewers check whether your hypotheses match what the boxes and arrows show.
The two terms get used interchangeably in casual writing, but reviewers do check the difference.
Study-specific map of your own variables
Borrowed structure from an existing theory
Six starting points, from a validated technology-adoption model to a bare input–process–output diagram.
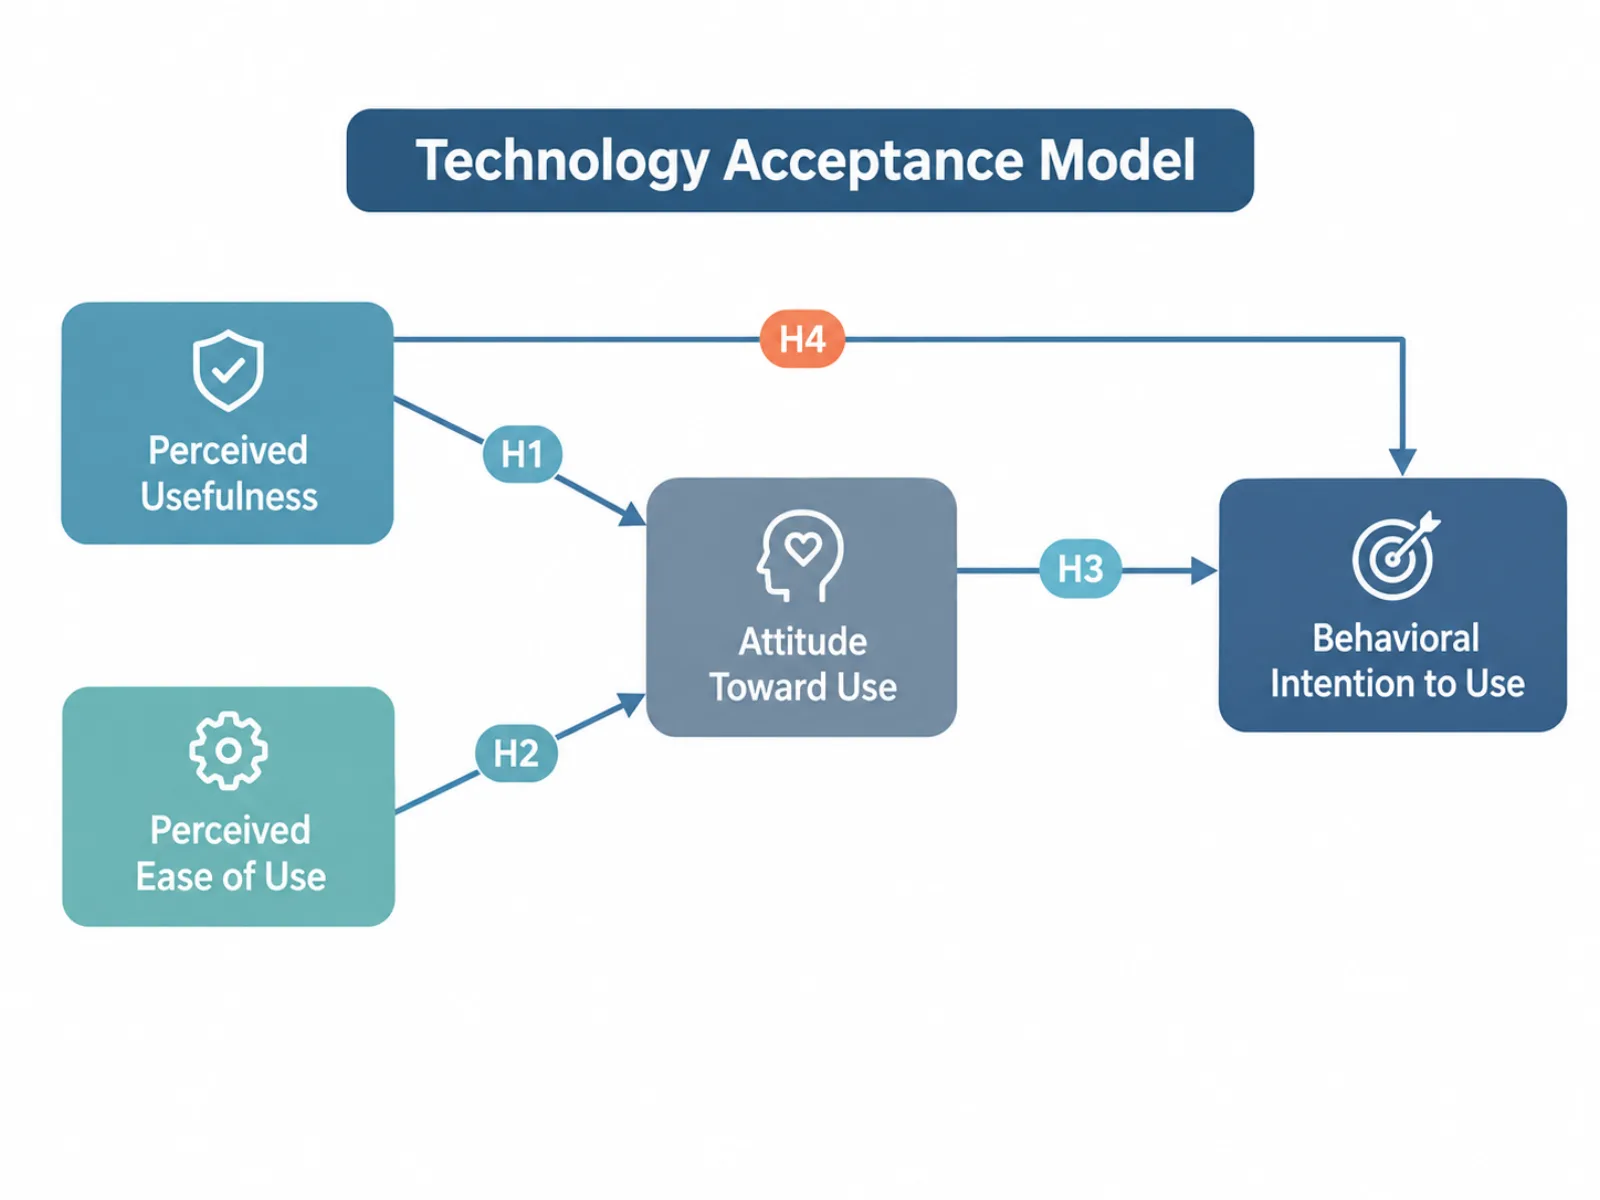
Perceived usefulness and perceived ease of use as independent variables driving behavioral intention, with actual system use as the dependent variable — the most cited base model in information-systems research.
Inputs such as resources and team composition feed a process step that produces measurable outputs — a structure common in operations and team-performance studies.
Study habits and parental involvement as independent variables, motivation as a mediator, and GPA as the dependent variable.
Health literacy as an independent variable predicting medication adherence, with social support tested as a moderator of that relationship.
Brand trust and price sensitivity as independent variables shaping purchase intention, mediated by perceived value.
Leadership style and training as independent variables affecting job performance, moderated by organizational culture.

Paste a plain-language description of your study and the conceptual framework generator tags each variable by its methodological role, then places it in the correct position — independent variables on the left, dependent variables on the right, mediators and moderators on the paths between them.
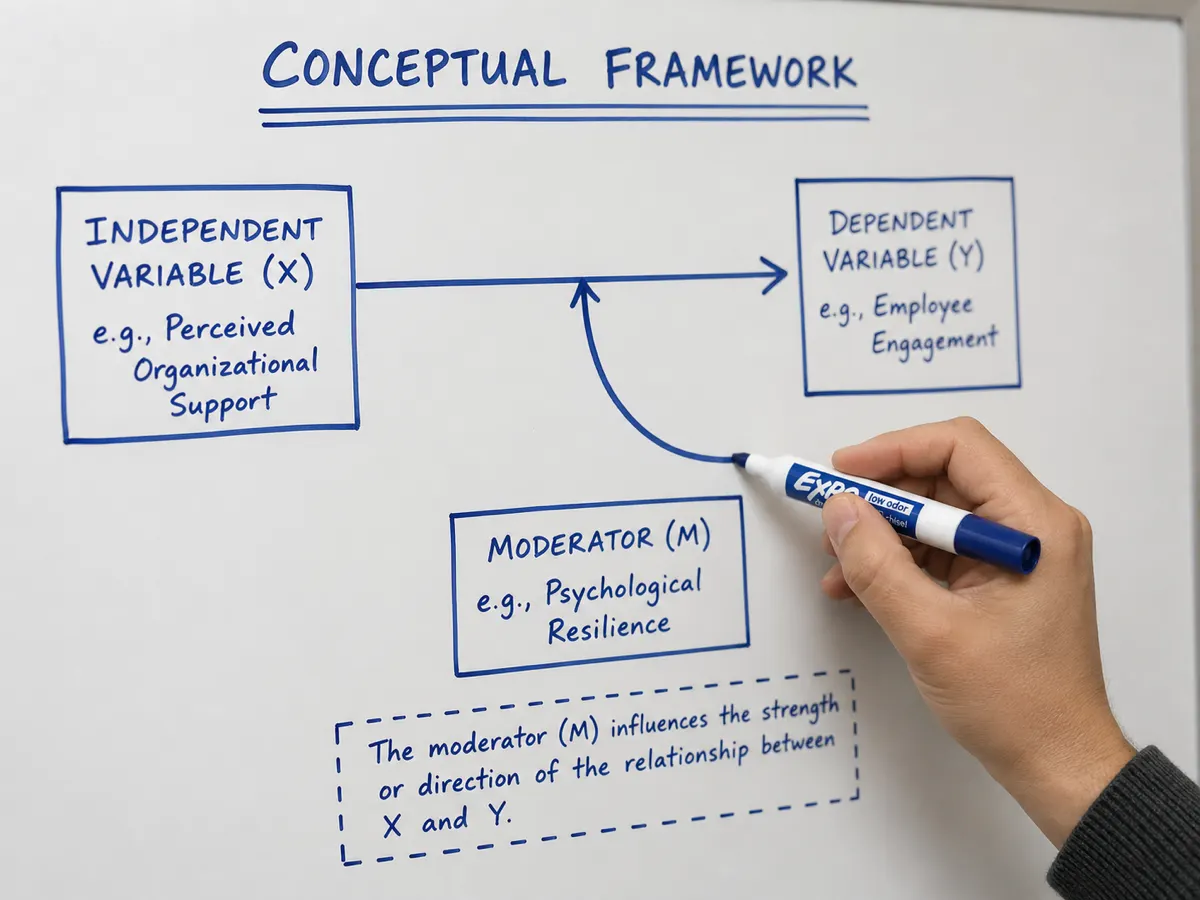
A mediator sits on the causal path and explains why an effect happens; a moderator sits beside the path and explains when or for whom it happens. The generator draws mediators inline on the arrow and moderators branching into it, so the diagram itself teaches the distinction instead of hiding it.
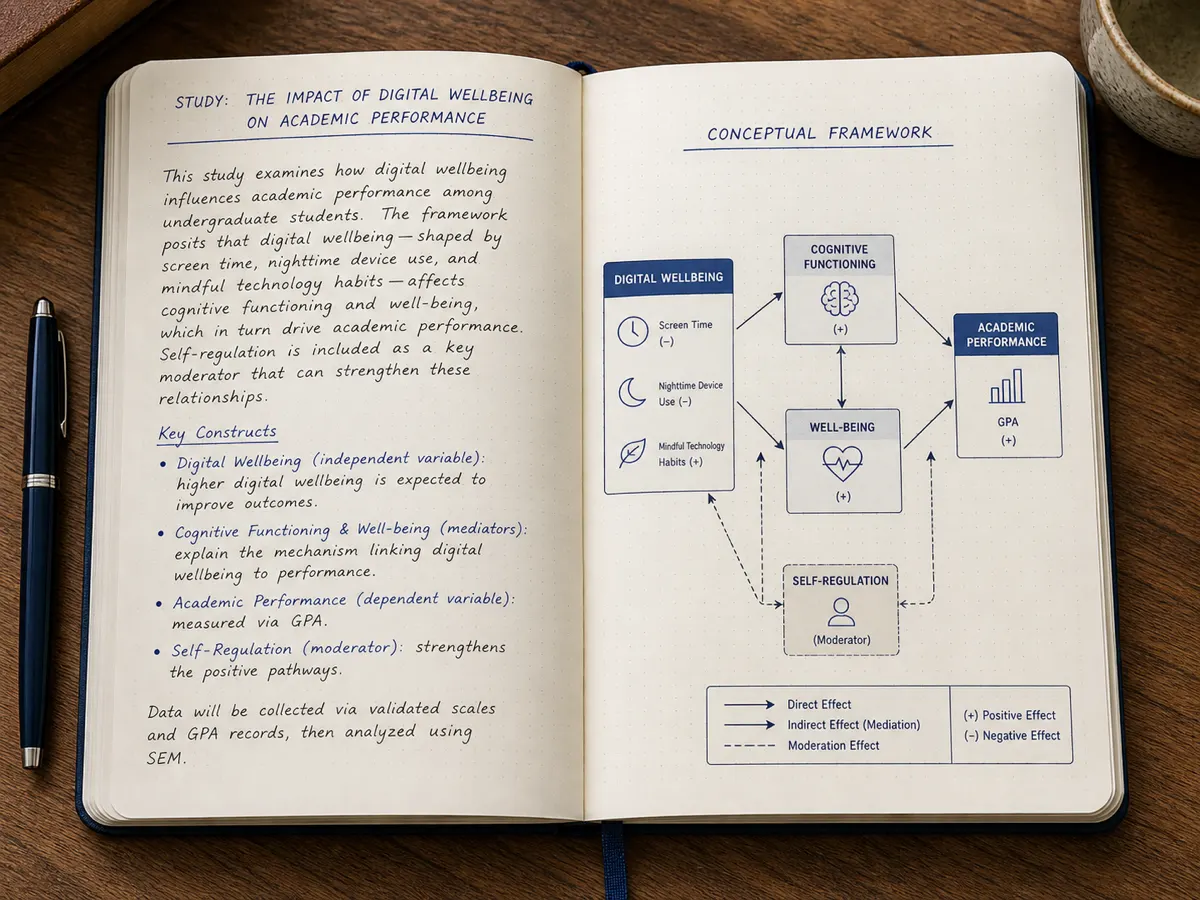
No node-and-arrow editor to learn. Describe your hypotheses the way you would to a supervisor, and the conceptual framework maker infers the boxes, the labels, and the arrow directions from that description.
An independent variable (IV) is the presumed cause you manipulate or measure — screen time, training hours, leadership style. A dependent variable (DV) is the outcome you measure — test scores, performance, purchase intention. Every framework needs one of each; the arrow between them is the hypothesis.
A mediating variable explains the mechanism between an IV and a DV: it sits on the causal path, so the arrow runs IV to mediator to DV. In TAM, perceived usefulness mediates design's effect on adoption — design works through perception, not directly.
A moderating variable changes the strength or direction of the IV-DV relationship without sitting on that path: the arrow points into the arrow itself. Self-control moderating social media's effect on grades means the effect is stronger for low-self-control students.
A conceptual framework forces a researcher to state, before data collection begins, exactly which variables matter and how they are assumed to relate — which one is the cause, which is the outcome, and what sits in between. Skipping this step often surfaces as a mismatch between the hypotheses and the analysis much later, when it is far more expensive to fix.
For readers, the framework works as a map: it connects the literature review to the methods section, showing why each measured variable was included and what relationship each arrow is testing. A reader who understands the framework in the first few minutes can follow the rest of the paper without re-deriving the logic from the methods alone.
Committees and reviewers use it the same way, but critically — to check whether the study design and the statistical model actually test the relationships the framework claims to test. A framework that draws an arrow the analysis never examines, or an analysis that tests a path the framework never drew, is one of the more common design flaws caught at defense or peer review.
In a thesis or dissertation, the conceptual framework typically closes chapter two: it synthesizes the studies reviewed into a single model of how the variables relate, and everything from chapter three onward exists to test that model.
Grant applications use it to show funders the theoretical basis for a proposed study — the expected causal pathway from intervention to outcome — before any data exists to support it, which is often what a preliminary-results figure cannot yet do.
In a journal article, the framework motivates the introduction's hypotheses and justifies the methods section's choice of variables and measures, so a reader can see why the study looked at these constructs and not others.
At a thesis or dissertation defense, the framework is frequently the first thing a committee interrogates directly — asking why a given arrow was drawn, why a variable was treated as a mediator rather than a moderator, or why an obvious alternative path was left out.
Four steps from a study description to an exportable diagram.
Write one or two sentences naming your independent, dependent, and any mediating or moderating variables — the same way you would summarize your hypothesis to a colleague.
The conceptual framework generator reads the description and assigns each variable its methodological role, then drafts the box layout.
Confirm each arrow direction matches your hypothesis, and move a variable between roles if the automatic classification does not match your design.
Download the framework as a high-resolution PNG and drop it straight into your methodology chapter or slide deck.
* Exports high-resolution PNG.
Methodology questions answered before you write your own.
* Exports high-resolution PNG.
Describe your study once and get a publication-ready conceptual framework diagram — free, no signup required.