

Pick a template — Frayer Model, KWL chart, Venn diagram, or cause and effect — fill it in, and export a print-ready graphic organizer. Free, no signup.
A graphic organizer is a visual layout that arranges ideas, facts, or steps so their relationships are visible at a glance — a box for each part, connected by position, lines, or arrows instead of a wall of prose. Teachers use them to make thinking visible: a student filling in a Venn diagram has to decide what belongs in the overlap, which is a different cognitive task than writing a paragraph about two things.
The category covers dozens of specific layouts, each suited to a different kind of thinking. Frayer Models break a term into definition, characteristics, examples, and non-examples. KWL charts track what a learner Knows, Wants to know, and has Learned across a lesson. Venn diagrams compare and contrast two or three sets. Cause-and-effect charts trace how one event leads to the next. The shape of the organizer is chosen to match the shape of the thinking it supports.
Because the structure is fixed and the content is short, graphic organizers work as both a learning scaffold and a formative assessment: a glance at a filled-in template shows a teacher whether a student grasped the relationship, without grading a full essay. This graphic organizer maker keeps that structure but replaces hand-drawn boxes and printed worksheets with a template you fill in on screen and export.
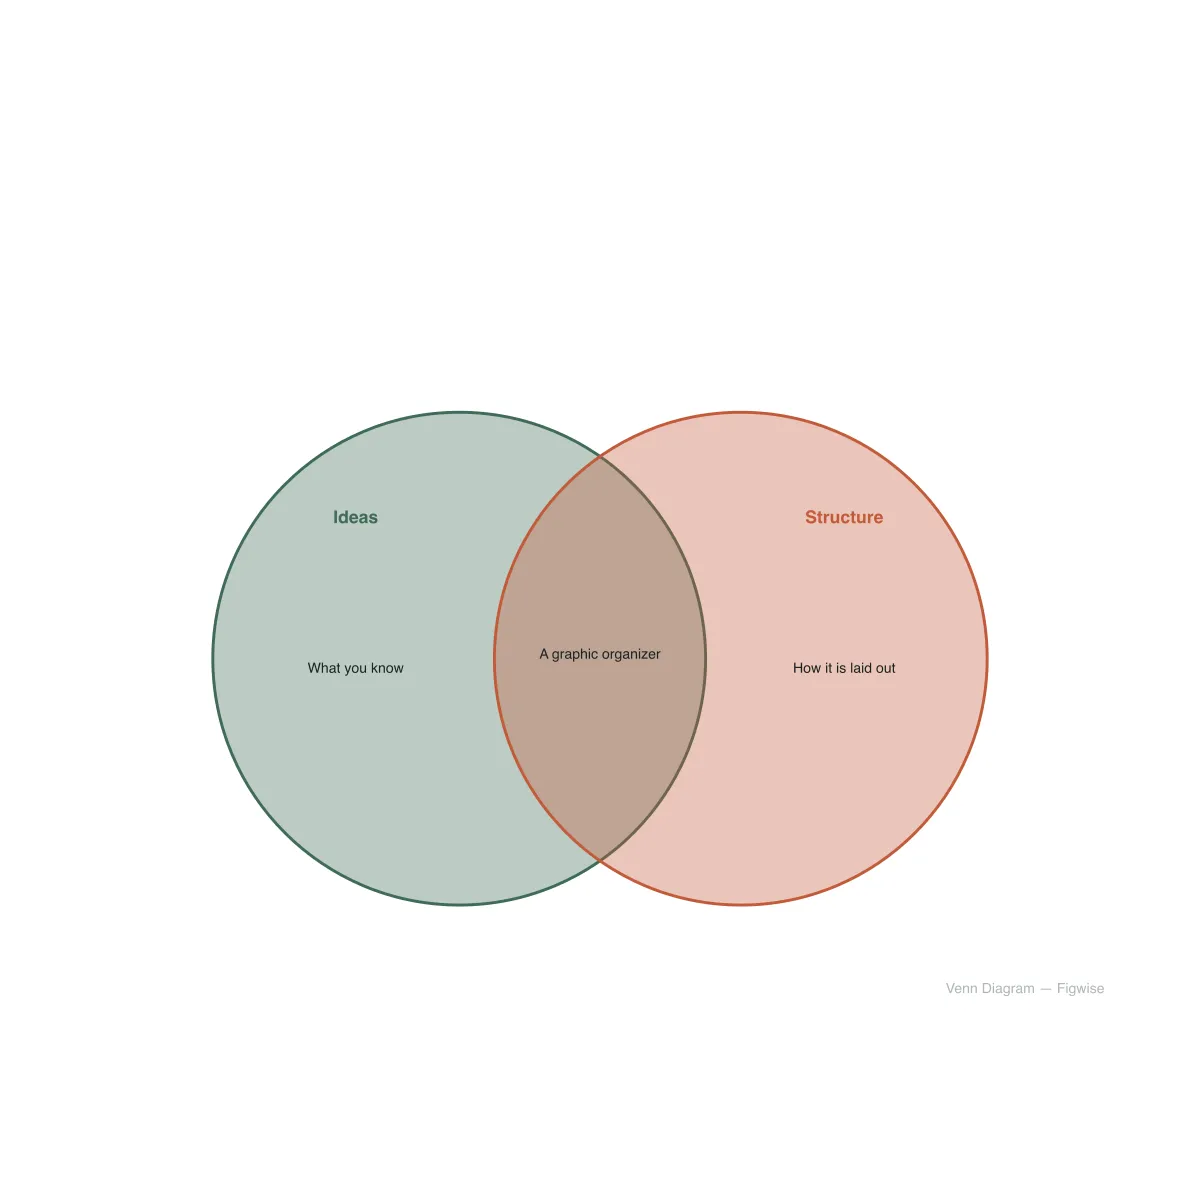
Every graphic organizer maps one kind of relationship onto one kind of shape. The four below are built into this tool with a live editor and export; the rest are common classroom formats this page describes so you know which shape fits your lesson, even without a ready-made template here.
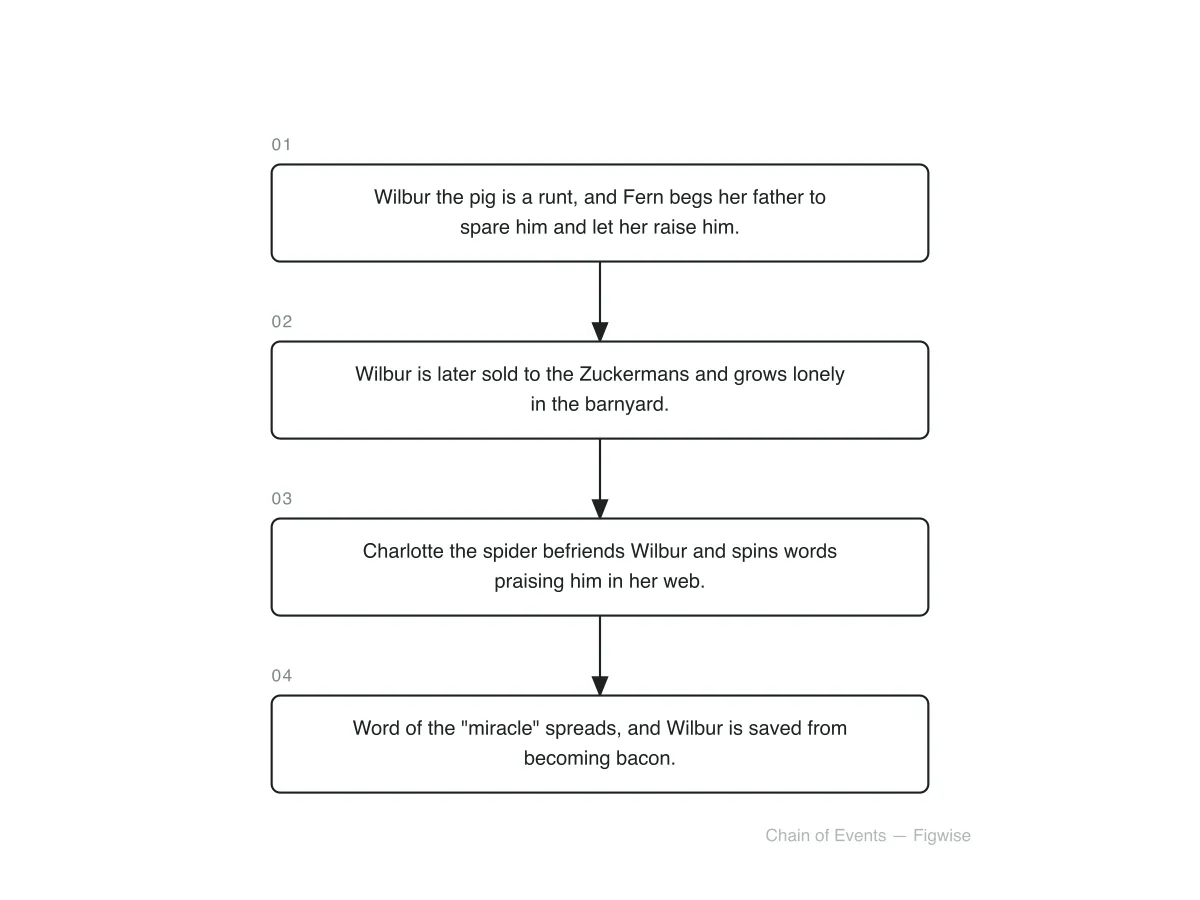
A story map breaks a narrative into its parts — setting, characters, problem, key events, and resolution — usually laid out as a sequence of connected boxes. It is a staple of elementary reading comprehension, used both before writing (to plan a story) and after reading (to summarize one).
A T-chart splits a page into two columns under a single divider, most often labeled pros and cons, facts and opinions, or before and after. It is the simplest possible two-column organizer, useful whenever the comparison has exactly two sides and no overlap to show.
A sequence chart lays out steps or events in strict order, connected by arrows, to teach chronology or procedure — the stages of a life cycle, the steps of a lab, or the order of a plot. Unlike a cause-and-effect chart, it does not claim that one step causes the next, only that it follows it.
A spider map, also called a bubble map, puts one central topic in the middle with several supporting details radiating out like legs. It suits brainstorming and note-taking on a single topic that has many attributes but no inherent order between them.
A compare-and-contrast chart lists two subjects side by side across a shared set of attributes, usually as a table rather than overlapping circles. It carries more attributes than a Venn diagram comfortably can, at the cost of not visually isolating what the two subjects share.
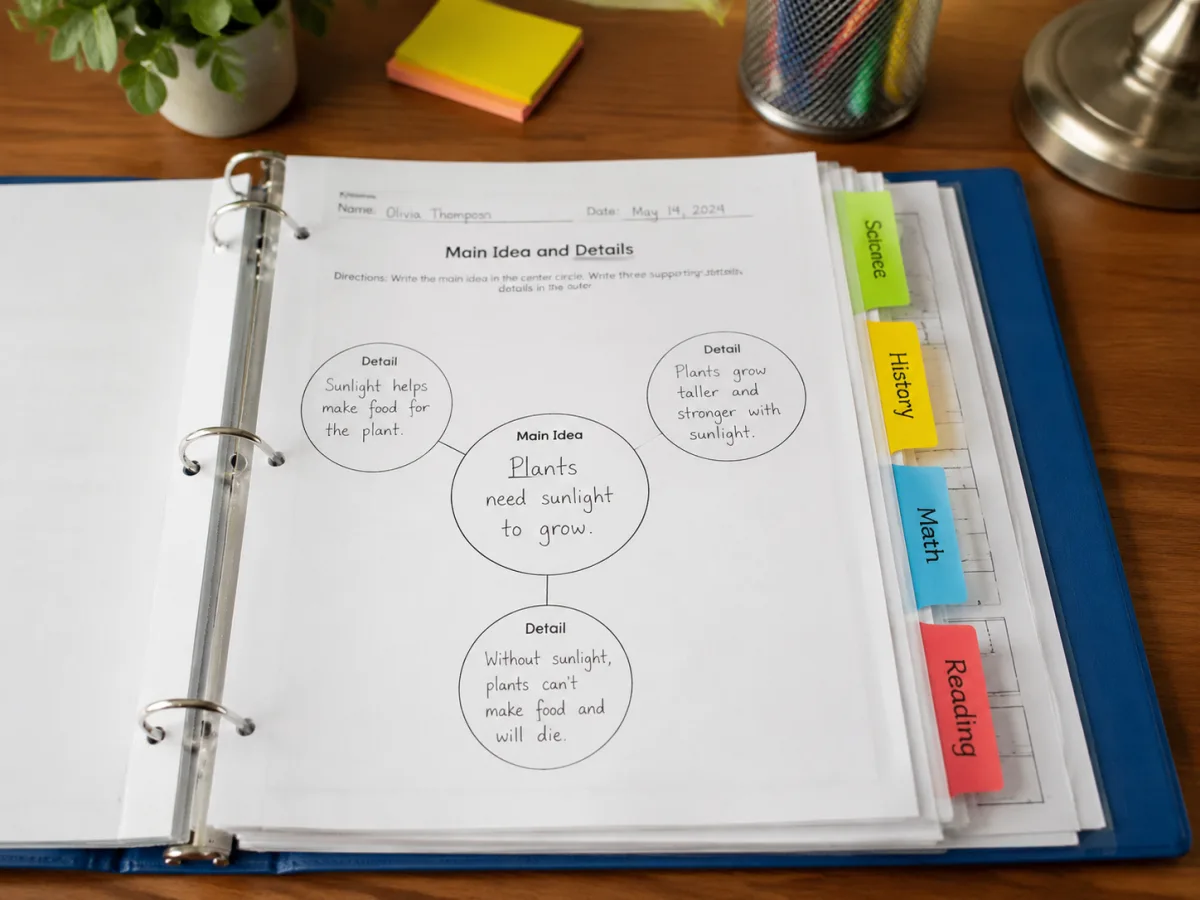
A main idea and details chart puts the central idea of a text in a top box with supporting details branching below it, the reverse structure of a spider map's brainstorm. It is commonly used to check reading comprehension: can a student pull the main idea out of a paragraph and back it with the right details?
The same four steps apply whichever template you pick.
Switch between Frayer Model, KWL chart, Venn diagram, and cause-and-effect using the tabs above the editor — each one loads its own layout and sample content.
Type directly into each box or column: the central term for a Frayer Model, the three column headers for a KWL chart, the set labels for a Venn diagram, or the cause-and-effect entries for a branching chart.
Each generator exposes the options that matter for its shape — circle count for a Venn diagram, branch count for a cause-and-effect chart — so the organizer fits your content instead of forcing your content into a fixed template.
Download the finished organizer as SVG for editing or print, or PNG for pasting into a slide deck or worksheet, straight from your browser.
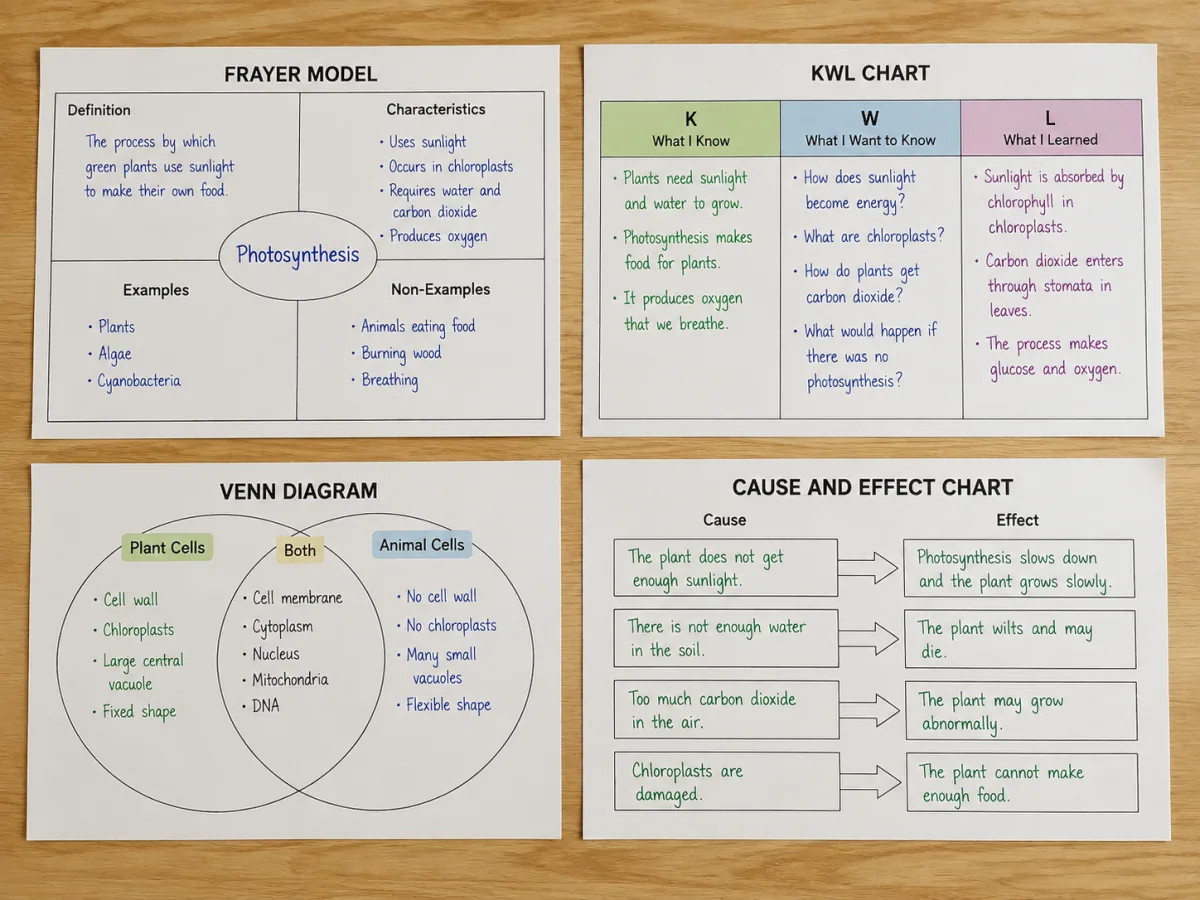
Frayer Model, KWL chart, Venn diagram, and cause-and-effect chart live in one tool with a shared export flow, so a teacher building a unit does not need four different apps for four different organizers.
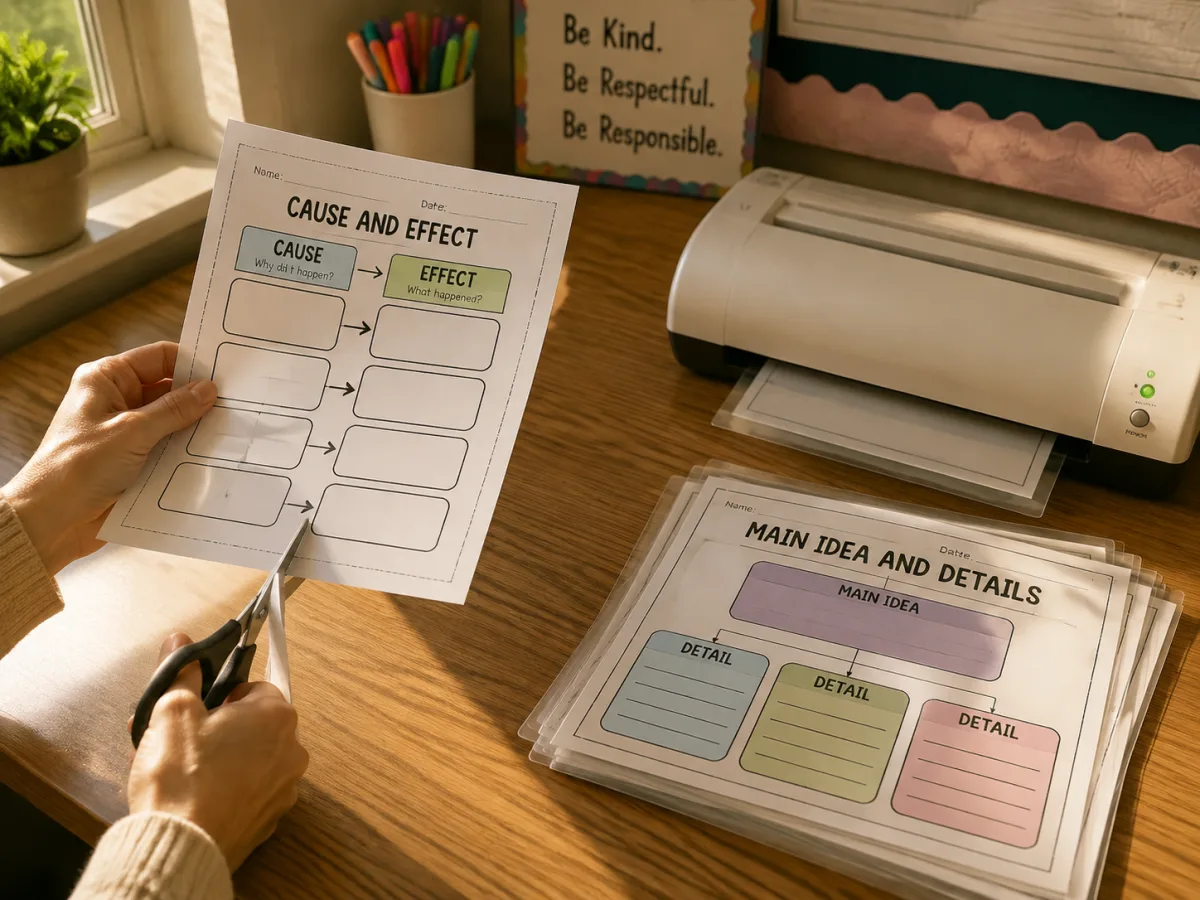
Every organizer exports straight from the browser with no account and no signup — SVG for further editing or clean print, PNG for dropping into a slide or a shared document.
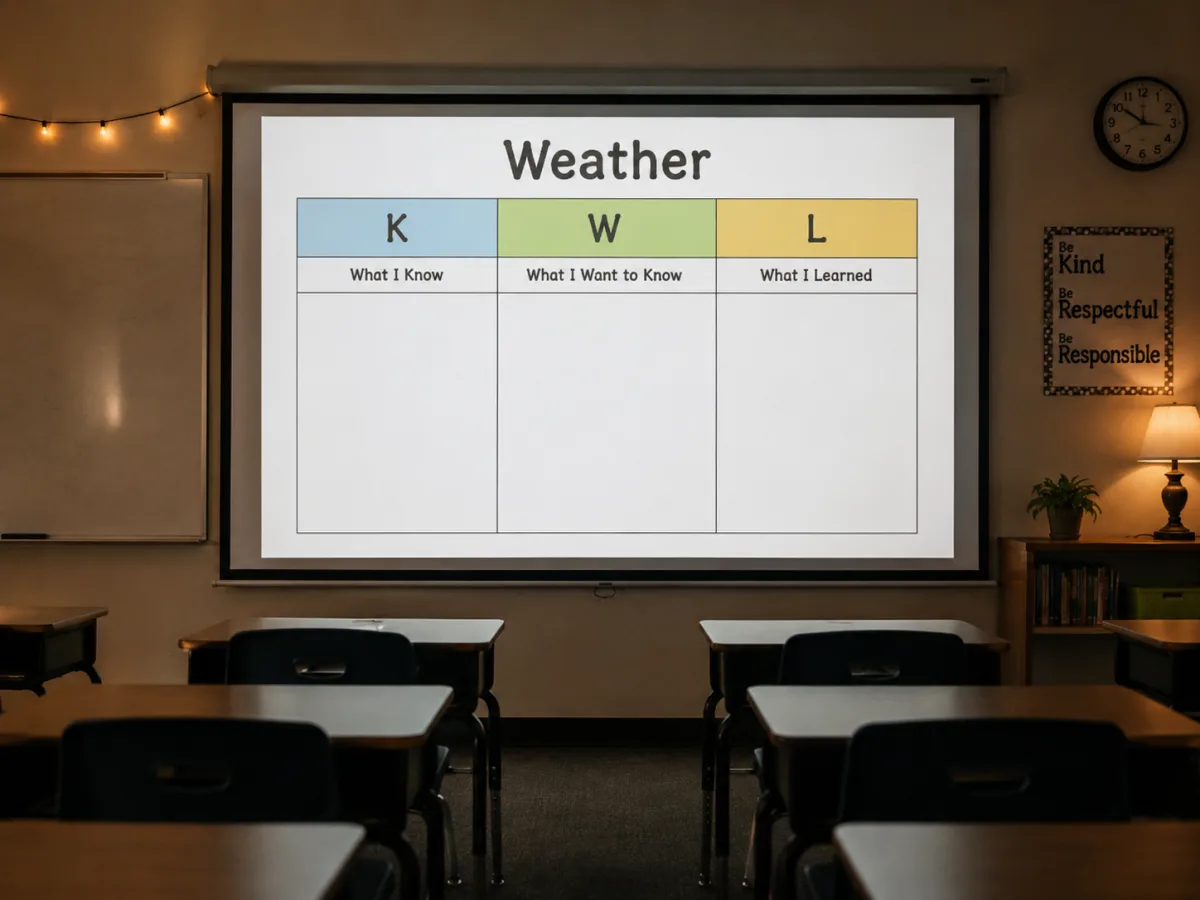
The same SVG that prints cleanly on a worksheet also scales up without blurring on a classroom projector or whiteboard, so one export covers both a handout and a whole-class walkthrough.
A Frayer Model works as well for a science vocabulary term as a math one; a cause-and-effect chart fits a history unit or a science lesson on ecosystems. The four templates here are subject-neutral by design, filled in with whatever content the lesson calls for.
Real output from the four generators on this page, covering the situations teachers reach for a graphic organizer most often.
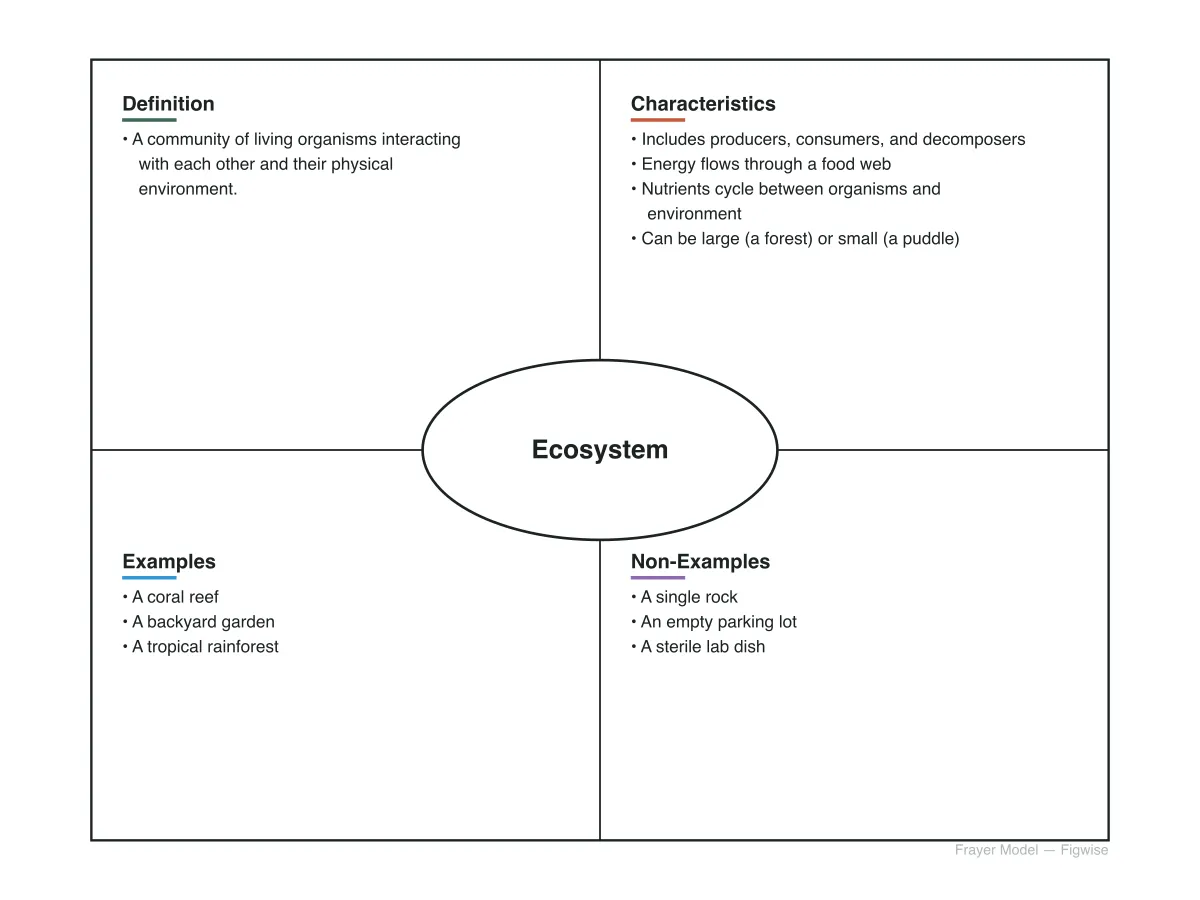
A four-quadrant Frayer Model breaking a vocabulary word into its definition, characteristics, examples, and non-examples.
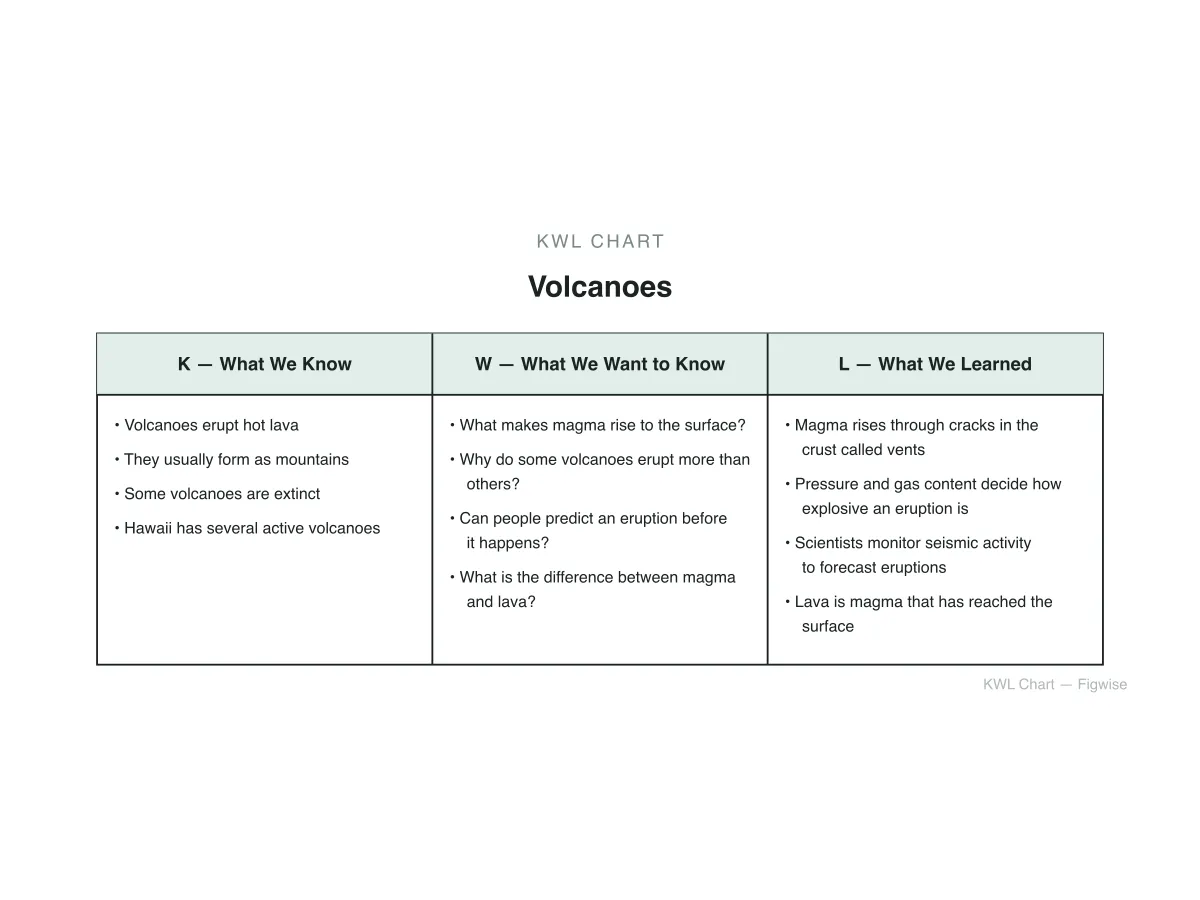
A KWL chart set up before a reading assignment, with the Know and Want-to-know columns filled in and Learned left for after.
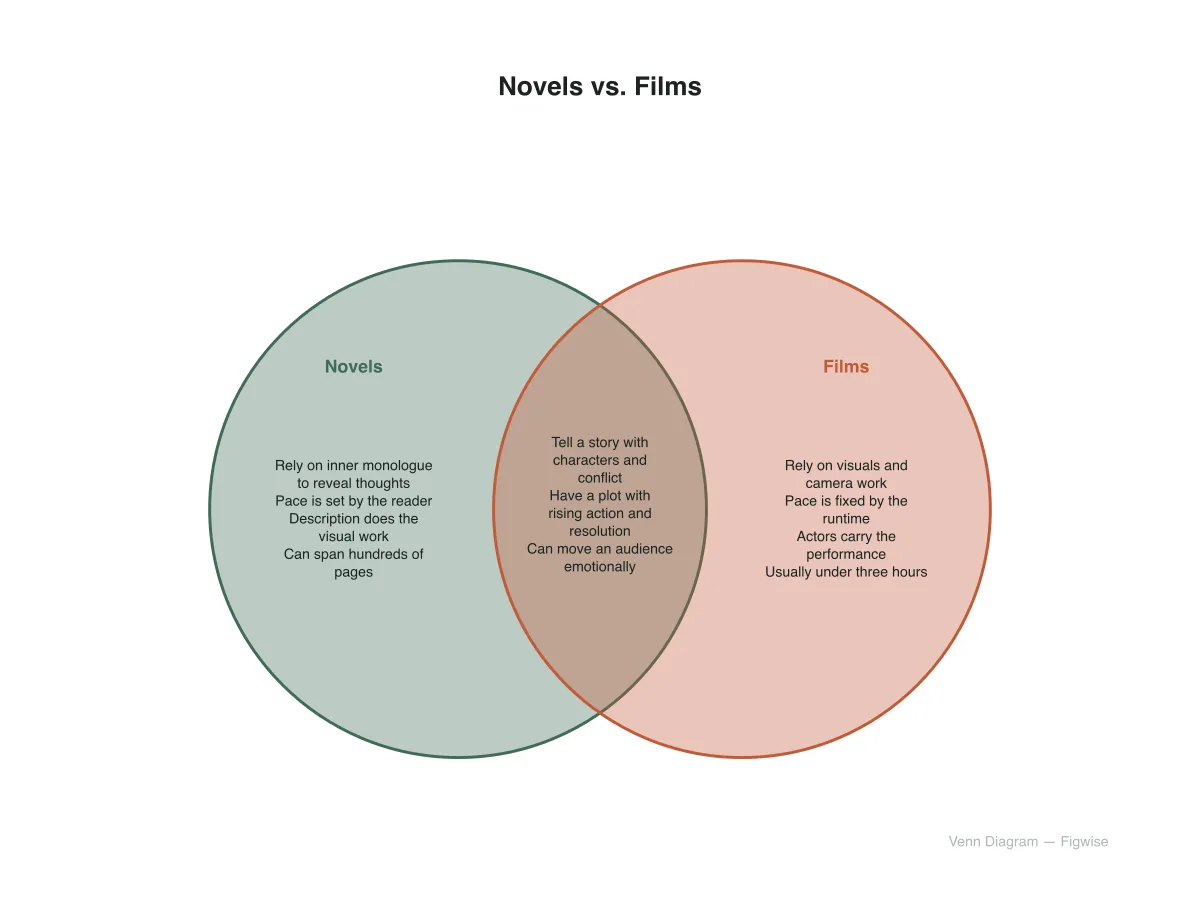
A two-circle Venn diagram sorting shared traits into the overlap and distinct traits into each outer ring.
A branching cause-and-effect chart tracing one historical event through several downstream effects.
Answers to the questions teachers and students most often ask about graphic organizers.
Pick a template, fill it in, and export a print-ready organizer — all in your browser.