

 Figwise Team
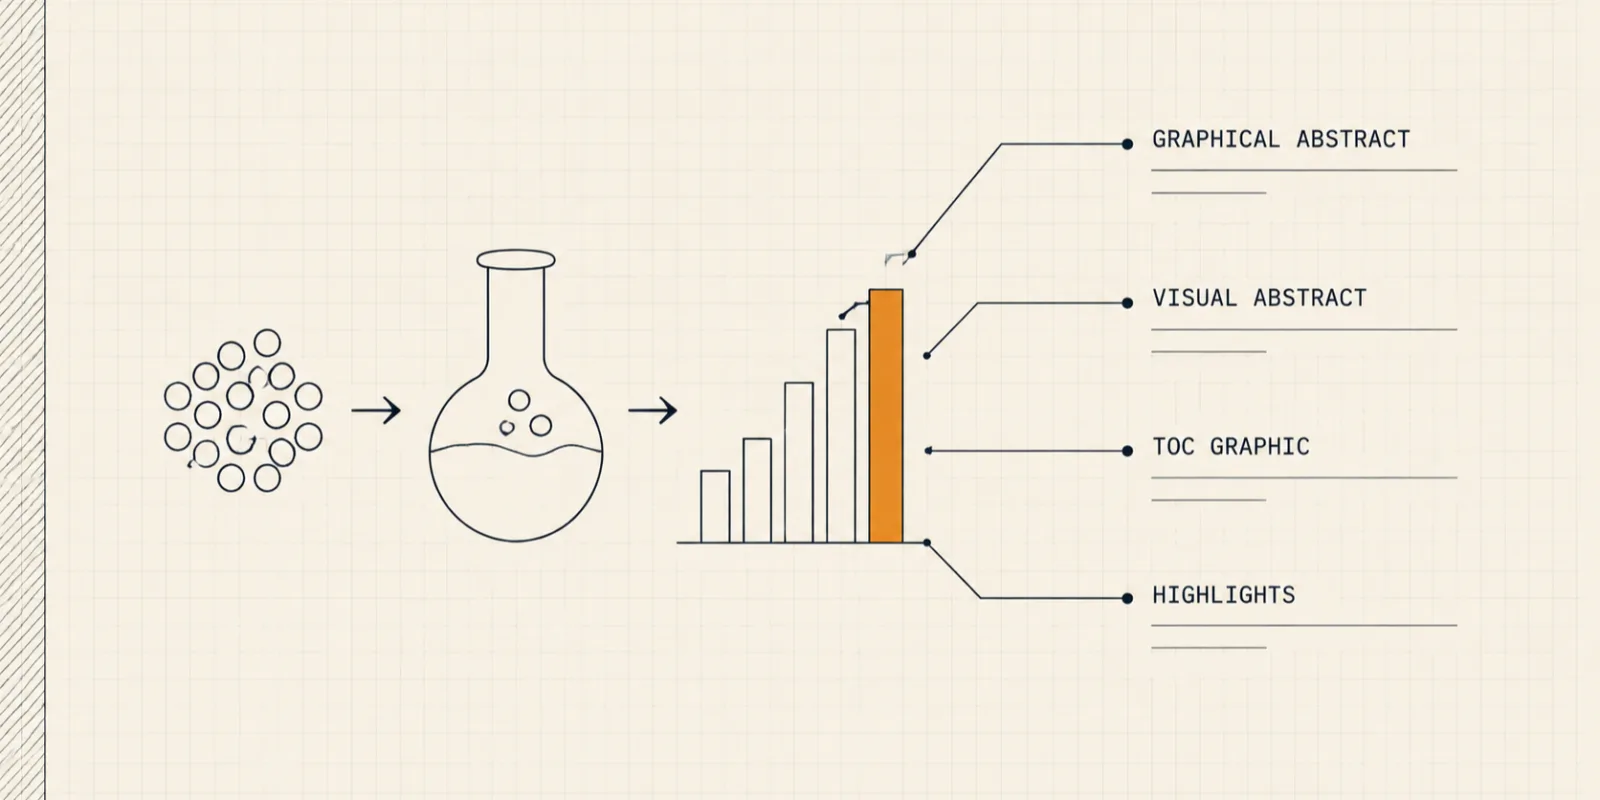
A graphical abstract is a single image, submitted alongside your written abstract, that shows the main finding of your paper at a glance. Here is the part most guides skip: PubMed and Google Scholar index your text, not your picture. A graphical abstract does not help people find your paper. It helps people who already found it decide to open it.
Below: what the image is, how it differs from a visual abstract, a TOC graphic, and Highlights, which journals really demand one, what the evidence says about whether it works, and what separates a good one from a bad one.
What a graphical abstract actually is
Most journals copy Elsevier's wording. A graphical abstract "summarizes the contents of your article in a concise, pictorial, professional form which is designed to appeal to an interdisciplinary audience."
Three rules hide in that sentence. It is one image, not a series. It is aimed at readers outside your subfield. And it carries the take-home message, not the method.
The Journal of Clinical Investigation says it more simply: "a single schematic image that visually represents the primary findings of an article."
Journals want one for their own reasons, and Elsevier states them plainly. The image is meant "to encourage browsing, promote interdisciplinary scholarship, and help readers identify which papers are most relevant to their research interests." A browsable contents list keeps readers on the journal's site, which is why the push comes from publishers rather than from authors.
Where it shows up, and where it doesn't
A graphical abstract lives in the places where readers browse, not in the places where they read.
Elsevier lists three: online search result lists, the online contents list, and the article page on ScienceDirect. It then adds a line that surprises most first-time authors. The image "will typically not appear in the article PDF file or print."
The JCI puts it at the top of the online article instead. Placement varies by journal.
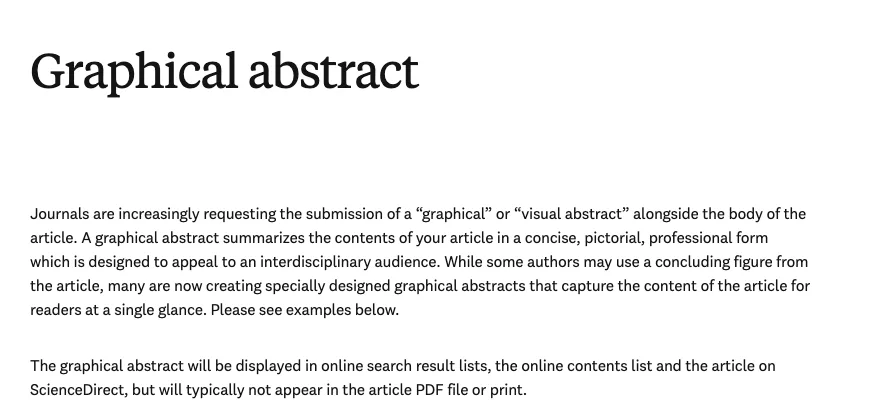 Elsevier's author page for graphical abstracts. Source: elsevier.com, checked August 2026.
Nothing on that list is a search index. PubMed, Scopus, and Google Scholar read your written abstract. They cannot read the picture. So "it makes my paper easier to find" is the wrong reason to make one.
How it differs from a figure in your paper
A figure in your paper argues with data. A graphical abstract states a conclusion.
Journals write this rule down, and they do not all write it the same way. The Cell Press graphical abstract guidelines say the image should "be distinct from any model figures or diagrams included in the paper itself" and should "not include data items of any type; all the content should be in a graphical form." The JCI allows the opposite on the first point: "A schematic model figure from the article itself may be used as the graphical abstract." Both ban data figures.
That gap matters, because reusing a figure is the default behavior. Yoon and Chung studied graphical abstracts across scholarly journals. About half were copied straight from figures already in the paper. Half the field is doing the thing Cell Press rules out.
If you want to see what the alternative looks like, we took four published graphical abstracts apart panel by panel.
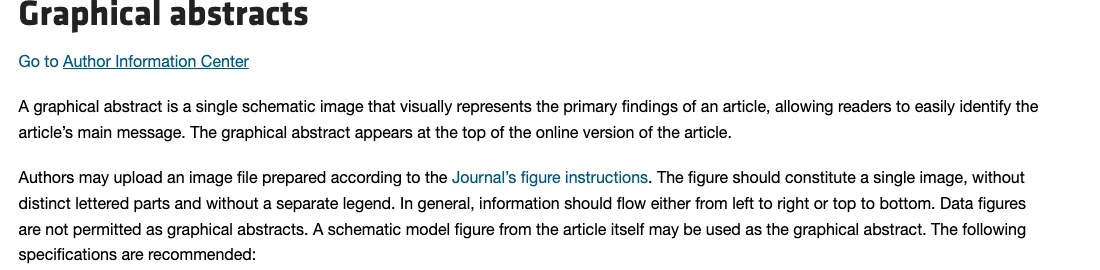 JCI's graphical abstract policy: optional to submit, and no data figures. Source: jci.org, checked August 2026.
Graphical abstract vs. visual abstract vs. TOC graphic vs. Highlights
Four names get used for what people assume is one thing. Two of them are the same thing, one is a different format, and one is not an image at all.
| Term | Who uses it | What it is | Where it appears |
|---|---|---|---|
| Graphical abstract | Elsevier, Springer Nature, JCI, most fields | One image summarizing the main finding | Search lists, contents lists, article page |
| Visual abstract | Medical journals, social media | A templated layout: title, key findings, icons | Mostly social posts, some article pages |
| TOC graphic | ACS and chemistry journals | The same image, treated as article metadata | Table of contents, article page |
| Highlights | Elsevier and Cell Press | Plain text bullet points, no image | Article page, search engines |
Visual abstract
A visual abstract is a graphical abstract in a fixed layout. The format came out of Annals of Surgery in 2016, where Andrew Ibrahim was creative editor and ran the first study on it. It pairs a short title with a row of key findings, each one an icon plus a number or a phrase.
In everyday use the two terms are swapped freely, and Elsevier's own page treats them as one. The difference only matters when a journal hands you a template and expects you to fill it in.
TOC graphic
ACS journals call it a table of contents graphic, or TOC graphic. Same image, different name, different status. ACS treats it as part of the manuscript file, not a promotional extra.
Highlights
Highlights are not a picture. Elsevier defines them as "three to five (three to four for Cell Press articles) bullet points," each one "no more than 85 characters, including spaces," with "no jargon, acronyms, or abbreviations."
They are a separate item, not a swap. If your journal asks for both, you send both. Two details catch people out: Highlights go in as a Word document, and they are "not part of editorial consideration and not required until the final files stage."
One term is missing from that table on purpose. Your written abstract is still the thing that gets indexed, searched, and read by machines. Every item above is an addition to it, and none of them replaces it.
Is a graphical abstract required?
It depends on the journal, not the publisher. The same publisher will mandate one in one title and ignore it in another, so a publisher-level answer is always wrong. Three patterns cover almost every case.
Required at submission
Some journals will not accept a manuscript without one. The Journal of the American Chemical Society states that "Communications and Articles must contain both an Abstract and a Table of Contents (TOC) graphic in the manuscript document file." Cell Insight is blunter: "A graphical abstract is mandatory for research article in this journal."
In both cases the image is part of the submission package, not an afterthought.
Asked for later
Some journals do not chase you for artwork on day one. Elsevier runs Highlights that way: they are "not required until the final files stage", and they are "not part of editorial consideration," so they play no part in the accept-or-reject decision.
Graphical abstract timing splits the same way, and no publisher-wide rule covers it. The only reliable answer sits on your own journal's page.
Optional but encouraged
This is the largest group. Elsevier says only that "journals are increasingly requesting" one, and tells authors to check the journal. The JCI wording is "Authors may upload an image file." Springer Nature hedges the same way — its own blog says "an increasing number of journals require the submission of a graphical abstract," which is a polite way of saying go and read your journal's page.
How to find your journal's answer in a minute
Open the journal's guide for authors and search the page for "graphical abstract" and "TOC graphic." You are looking for one of three verbs: must, may, or are encouraged to. That verb is your answer.
While you are on that page, check the AI policy too. Elsevier's is strict and specific: "General-purpose generative AI image tools must not be used to create graphical abstracts," and authors "are encouraged to use dedicated scientific illustration tools" instead. We tracked how different publishers word their AI figure policies in a separate post.
One more thing to look up while you are there: size, resolution, and file format are set per journal and no two are alike. We keep those in a journal-by-journal requirements table so you can check yours before you start drawing.
Do graphical abstracts actually work?
They buy attention. They do not appear to buy citations. The gap between those two sentences is where most of the marketing lives.
What publishers claim
Elsevier's author page states that "the average annual use of an article is doubled when compared with those without a visual abstract." That is the publisher's own figure, on its own author-facing page, and the method behind it is not public.
Other publisher pages look like extra proof and are not. Springer Nature's blog quotes roughly three times the views and eight times the engagement, and credits those numbers to Ibrahim et al. 2017 — the same Twitter study covered below. One dataset, counted twice.
What the studies found
Three peer-reviewed studies have tested this, and they do not agree.
Ibrahim and colleagues (2017) ran a case-control crossover study at Annals of Surgery. Tweets with a visual abstract got 7.7 times the impressions, 8.4 times the retweets, and 2.7 times the article visits. Read the comparison carefully: it is a tweet with an image versus a tweet with only a title. It is evidence about social posts, not about journal pages.
Bennett and Slattery (2023), in Scientometrics, looked at 562 sport science articles, 96 of which had a graphical abstract. Articles with one scored higher on Altmetric attention. Citations showed no difference.
Pferschy-Wenzig and colleagues (2016), in Molecules, found the reverse. Papers published without a graphical abstract did better on PDF downloads, abstract views, and citations. The paper carries a 2016 erratum. One column in Table 2 was marked with a percent sign, but the values were ratios, so they need multiplying by 100.
Jambor and Bornhäuser read the whole body of evidence the same way in PLOS Computational Biology in 2024. Graphical abstracts do not always raise full-text reads or citations. They do raise abstract views and Altmetric scores.
What this means for your paper
A graphical abstract earns its keep if you will actually put it somewhere: a conference slide, a lab page, a grant application, a post. If your journal requires one, the choice is made for you. If it does not, and the image will just sit on the article page, your time is better spent on the written abstract.
What separates a good graphical abstract from a bad one
Most of the rules are the same across publishers, and most of them are about restraint.
- One point, not one paper. Cell Press asks authors to "highlight one process or make one point clear." Everything else is cutting-room material.
- A clear start and a clear end. Both Elsevier and Cell Press ask for a layout that reads top-to-bottom or left-to-right. A reader should not have to hunt for the entry point.
- Text used sparingly. Simple labels, no paragraphs. Cell Press says so directly.
- No data items. Cell Press bans them outright; the JCI bans data figures too.
- No title inside the image. Elsevier asks authors not to use "a heading 'graphical abstract' within the image file." The journal adds that label itself.
- Colors that work without color vision. ACS tells authors to "avoid relying on color alone to represent information" and to add symbols, labels, or patterns instead. Red-green pairings are the usual trap.
- Language a neighbouring field can follow. The whole point is the interdisciplinary reader. Undefined abbreviations undo it.
How to make one
Three routes, depending on what you have. You can draw it yourself in PowerPoint, Illustrator, or Inkscape. You can use a dedicated scientific illustration tool, which is what Elsevier's AI policy points authors toward. Or you can start from your abstract and generate a draft layout to edit.
Our own graphical abstract maker sits in that third group. Be clear about what it hands you: a flat PNG from a general image model, with no text layers you can edit. Under Elsevier's rule that is not a file you send to a journal as-is. Use it to settle the layout and the story, then rebuild the final art in an illustration tool.
For the steps themselves — pick the message, sketch, label, export — see our step-by-step guide to making a graphical abstract.
Frequently asked questions
Does a graphical abstract need a figure legend?
No. The JCI states the figure should stand "without a separate legend," and Elsevier asks authors to embed any text and labels in the image file itself. Some journals do ask for a short caption or a line of "graphical abstract text" as a separate field, so check the submission form rather than guessing.
What is "graphical abstract text"?
For an Elsevier journal, it means the words inside the picture, and there is nothing else to write. Elsevier's instruction is explicit: "No additional text, outline, or synopsis should be included. Any text or label must be part of the image file." A handful of journals outside Elsevier do collect a short description in their own submission form, so check the form rather than assuming.
Can a review or systematic review have one?
Yes, and reviews are often the easiest case, because the structure of the review gives you the structure of the image. The trap is scope: a review covers more ground than one panel can hold. We wrote about what changes when the paper is a review separately. For a systematic review, the flow of studies belongs in a PRISMA diagram, not in the graphical abstract.
Is a graphical abstract the same as an infographic?
No. An infographic is built for a general audience and can run long, with multiple sections and a lot of text. A graphical abstract is one panel for a researcher in a nearby field. Borrowing infographic habits is a common way to fail a journal's check: pretty icons, dense captions, a headline across the top.
Can I reuse a figure from my paper?
It depends on the journal — see the comparison above, where the JCI and Cell Press flatly disagree. The separate question is whose figure it is. Elsevier tells authors to get "the necessary permission to include any third party-owned material," which covers a figure from a paper you did not write, and most stock icons.
Before you start drawing
Three things are worth carrying away. A graphical abstract is one image that states your main finding for a reader outside your field. Whether you need one is a journal-level question, answered by a single verb in the guide for authors. And the evidence says it will move attention, not citations — so make one when you have somewhere to put it.
When you are ready to build it, start with the layouts other authors used and check your journal's size and format requirements before you export.