

 Figwise Team
A graphical abstract is one image that carries your paper's main finding at a glance. Most guides give you the same five steps: find your message, sketch it, design it, cut it, ask a friend. Those steps are fine, and they take an afternoon.
The rework comes from three decisions nobody puts up front.
- Tool. BioRender's free plan is marked "No commercial use or publication," so figures drawn there cannot go in your paper.
- Layout. Pick a shape before you read your journal's requirements and you may draw a square for a journal that wants a wide banner. That is a redraw, not a resize.
- Timing. Build it the night before you submit and your coauthors glance at it instead of reading it, so a wrong arrow ships.
Decision 1: pick a tool you can legally publish from
The tool is a licensing question before it is a taste question.
BioRender is the tool every guide names, and most people sign up for the free plan. That plan is listed as "No commercial use or publication." Publishing rights and high-resolution, watermark-free export sit on the paid tiers, which start at $35 a month for one academic user, billed annually. Industry pricing starts higher.
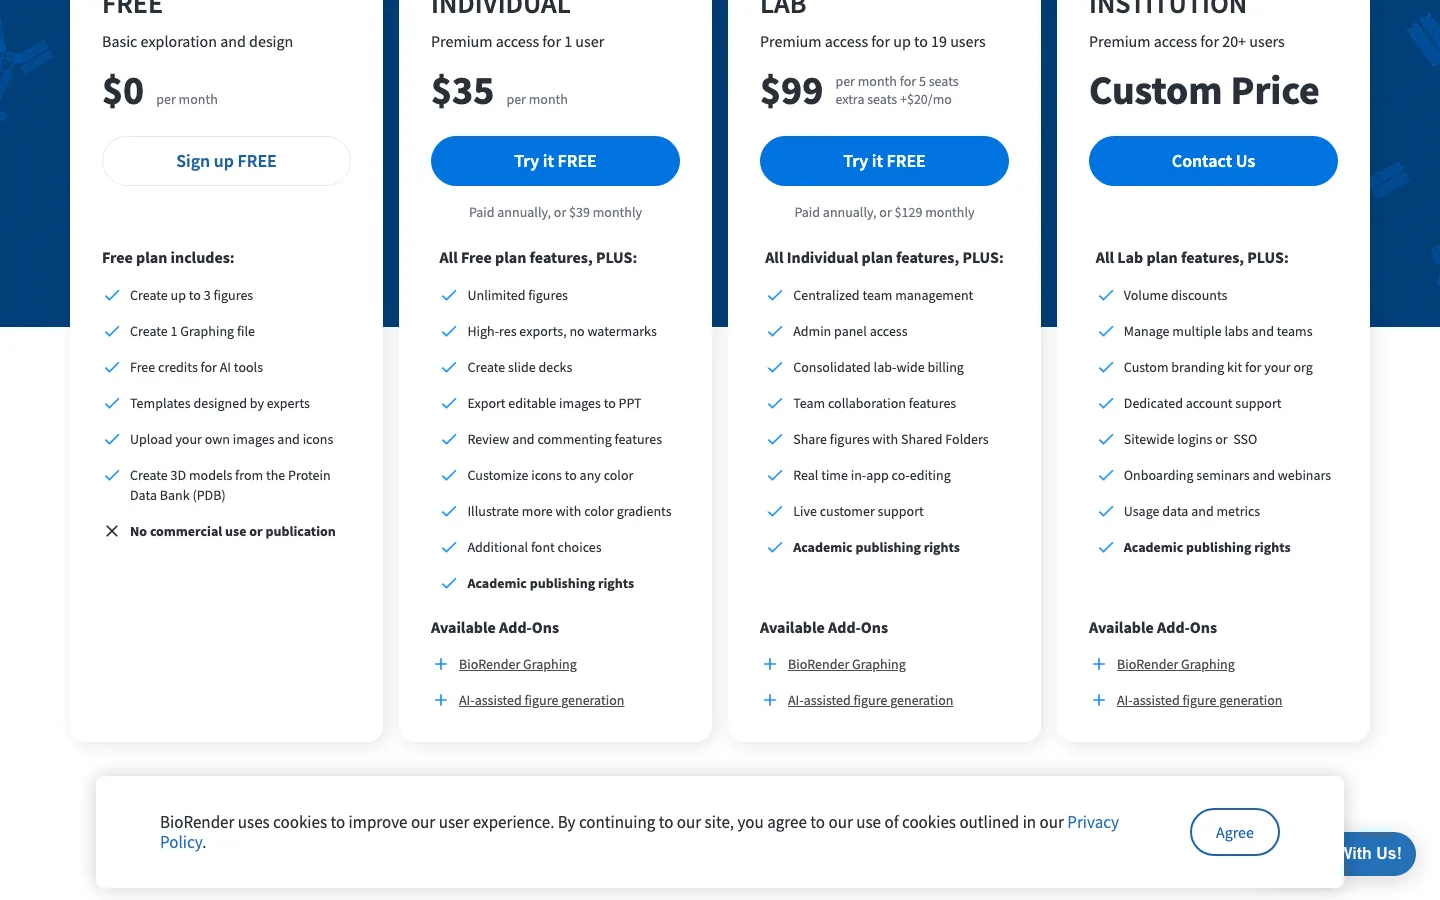
BioRender's plan comparison. The free plan's last line reads "No commercial use or publication." Source: biorender.com/pricing, checked 24 August 2026.
The FAQ at the bottom of that same page says it plainly: "we do not allow figures made on the free plan to be used for publications or commercial use."
You do not need drawing skill. You need boxes, arrows and labels that line up, in a file a coauthor can still open next year.
| Tool | Editable later | Notes |
|---|---|---|
| PowerPoint or Keynote | Yes, by anyone | Elsevier hands out an abstract template in this format |
| Inkscape | Yes, free | Vector, no license worry, steeper start |
| Adobe Illustrator | Yes, paid | Most control, most learning |
| BioRender, Mind the Graph | Yes, on a paid plan | Science icon libraries, publishing rights included |
| A general AI image tool | No | Ruled out, for the reason below |
Decision 2: generative AI is ruled out for this figure
Elsevier's generative AI policy for journals singles out this figure type by name:
"General-purpose generative AI image tools must not be used to create graphical abstracts."
The same section says what to use instead: "Authors are encouraged to use dedicated scientific illustration tools when preparing graphical abstracts."
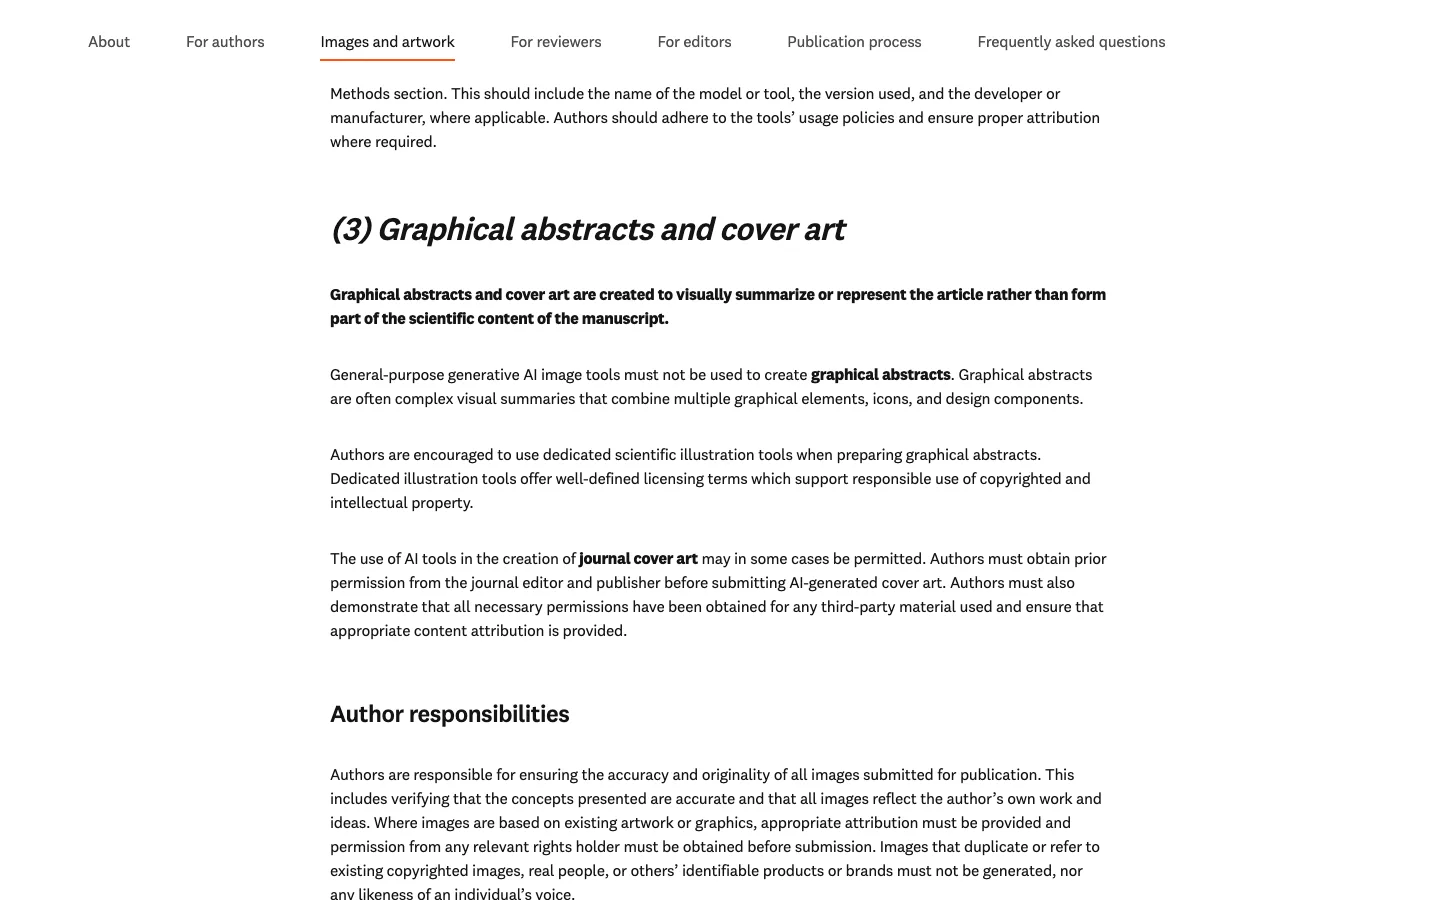
Elsevier's rule for graphical abstracts and cover art. Source: elsevier.com, captured 24 August 2026.
Other publishers word this differently, and a few are stricter still — we quoted six publishers' AI figure rules side by side. Whichever tool you land on, name it in the image caption before you submit.
That includes our tool. The graphical abstract maker on this site sends your abstract to a general image model and returns a flat PNG with no editable labels, so for a submitted graphical abstract it falls on the side Elsevier rules out. Use it to see a layout fast. Rebuild the file you submit in an illustration tool.
Decision 3: keep the file you can edit
The journal never gets an editable copy, so yours is the only one that exists.
Elsevier requires that "any text or label must be part of the image file." Your submission is a flattened picture by design. A copy editor may ask you to fix one label after acceptance, months later. The flat file is no help then.
Export what the journal asks for, using the settings on the requirements page, then save the editable source next to your manuscript, named so a coauthor finds it. With the source, the fix takes two minutes. Without it, you rebuild from nothing.
When to build it in the submission cycle
Build the concept while you are drafting the discussion, not the night before.
Elsevier asks authors to "submit your graphical abstract as a separate file in the online submission system," which means it is finished work at the moment you submit, not something you patch later. Three stages that work:
- While drafting — write the take-home sentence and sketch the shape. Cheap, and it often sharpens the discussion.
- During coauthor review — the draft image travels with the manuscript, so a coauthor catches a wrong arrow now instead of at proof stage.
- The week before submission — build the final file to spec.
Your coauthors read the manuscript closely and glance at the image. An error there survives the review that would have caught it anywhere else.
Let your paper type pick the layout
Which shape you get is decided by what your paper argues. Pick wrong and you redraw, rather than re-cut.
- Mechanism — you explain how something works. Draw the parts and the arrows between them, and label every arrow with a verb: activates, blocks, converts.
- Pipeline — you run a process end to end. Stack it in stages, one row per stage, each row titled.
- Comparison — you contrast two conditions or groups. Two columns, tinted differently, the same elements in the same place on both sides.
- Numbers — your result is the number. Make the number the biggest thing in the frame.
You can see what each shape looks like finished before you commit to one.
Reviews are the exception. A pipeline shape pulls you toward drawing your search and screening process, which is your PRISMA diagram's job. Show scope and synthesis instead of sequence — we treat that case in graphical abstracts for review papers.
The rest is craft, and publishers have written it down
The design rules are not in dispute. Cell Press publishes them, and they are worth following literally.
- One point. "Highlight one process or make one point clear," and be "free of distracting and cluttering elements."
- A route through the image. It should "have a clear start and end, 'reading' from top-to-bottom or left-to-right." Sketch that on paper first; fifteen minutes with a pen kills layouts that cost an afternoon on screen.
- Words, used sparingly. "Use simple labels" and "use text sparingly." The image still has to stand alone for someone who has not opened your paper, so spell out any abbreviation that is not standard outside your field.
- Not your paper's figure. It should "be distinct from any model figures or diagrams included in the paper itself," and "not include data items of any type; all the content should be in a graphical form." Delete the pasted chart.
- Restrained color. Cell Press warns that "heavily saturated, primary colors can be distracting." One hue in shades, plus black, white and grey, covers most abstracts.
Then show it to one colleague in your field and one outside it. Do not ask whether they like it; ask them to say out loud what they see, in order. Where they start tells you if your route works. Where they hesitate is your problem.
Questions authors ask
Can I make a graphical abstract in PowerPoint?
Yes, and plenty of published ones were. The catch is export, not design: PowerPoint's default output often misses a journal's file type and resolution rules, so check the saved file against them rather than the slide.
Answered in more depth elsewhere. Whether your journal actually requires one depends on the journal, not the publisher — we sorted the three cases and how to check yours. If you are unsure which artifact you have been asked for, compare graphical abstract, visual abstract, TOC graphic and Highlights. And before you spend a week on this, the evidence that graphical abstracts win readers is mixed, with the studies laid out.
Before you open a design tool
Pick a tool you can publish from and edit later, let your paper type pick the shape, and build the concept while you are still drafting. The drawing was never the expensive part.