

Map the causes and effects around one event, or lay out a chain of events in sequence, then export a clean diagram for reading comprehension, history, or science class.
A cause and effect graphic organizer is a visual tool that separates why something happened from what happened as a result. Instead of describing an event and its consequences in a paragraph, it puts each cause and each effect in its own box, connected to the event by an arrow, so the relationships are visible at a glance.
Two layouts cover most classroom needs. A multi-cause, multi-effect version puts one event in the center with causes feeding in from one side and effects branching out the other — useful when a single event has more than one driver or more than one consequence. A chain layout instead links a series of events end to end, where each one causes the next.
Teachers use this organizer to build reading comprehension worksheets, map historical turning points, or diagram a science process like erosion or the water cycle. Students use it to plan an essay, retell a story in order, or study for a test by seeing a topic's structure instead of just its text.
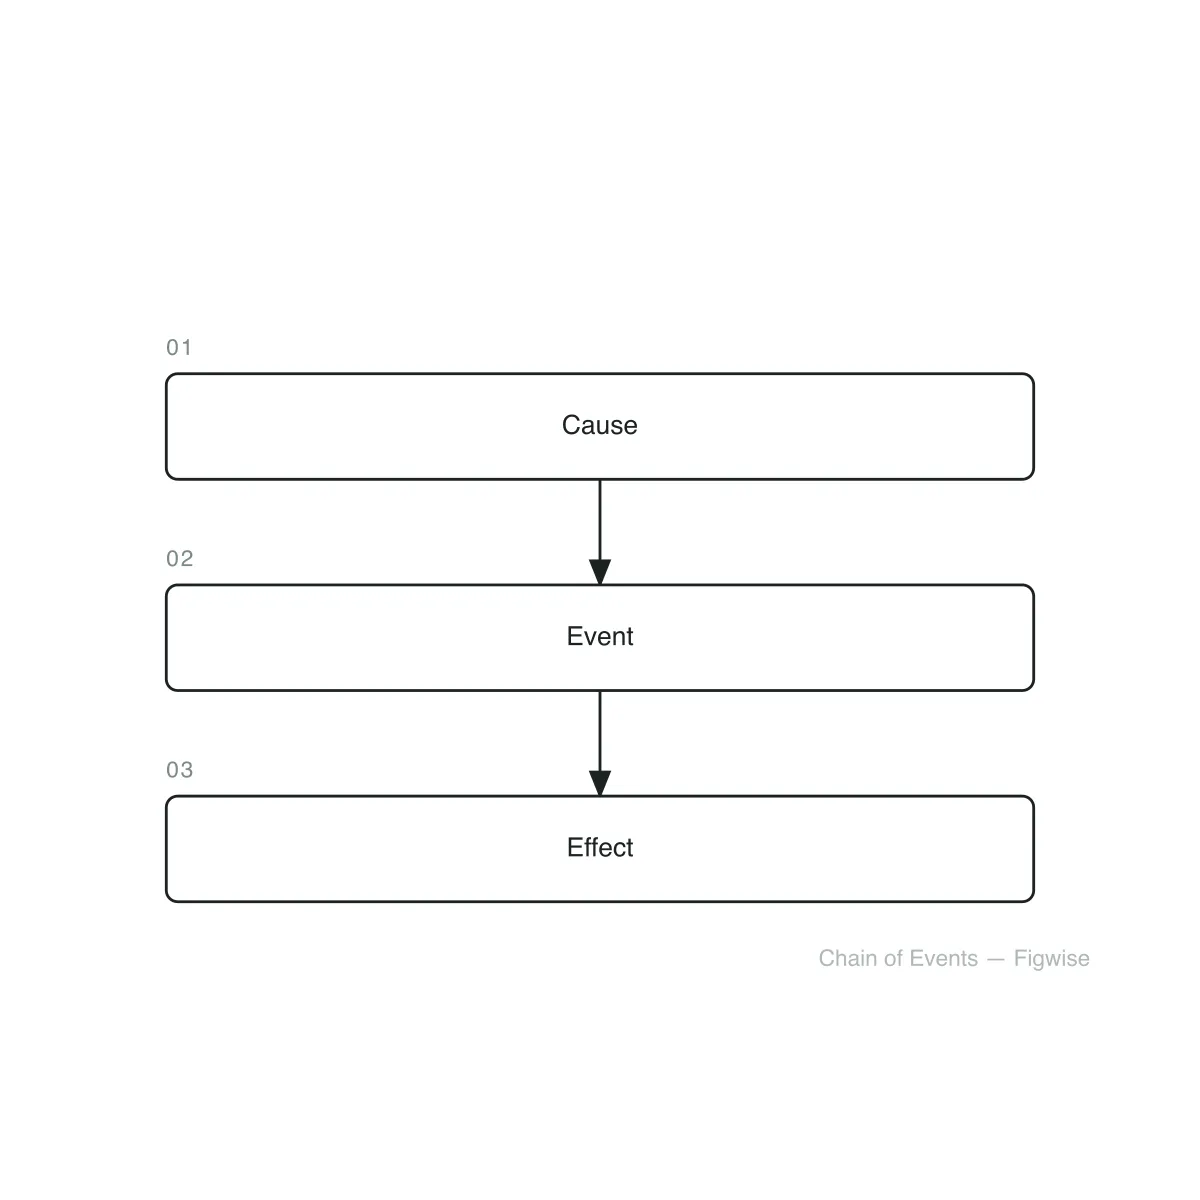
Four ways students and teachers actually use this generator, from a single story's plot to a full science process chain.
A reading comprehension worksheet built around one turning-point event in a short story, with the causes that led to it and the effects that followed on either side.
A history class diagram showing how more than one cause fed into a single event, and how that event produced more than one lasting effect.
The chain layout used for a cyclical process, where each stage causes the next — evaporation, condensation, precipitation, and collection.
A sequencing worksheet that turns a passage into an ordered chain of events, useful for retelling practice in early elementary grades.
Here is how this generator turns a topic into a finished cause and effect chart, ready to print or drop into a slide.
Choose Causes & Effects for one event with multiple causes and effects, or Chain of Events for a sequence where each step leads to the next.
Type the central event and its causes and effects, or type each step of the chain in order. Add or remove boxes as the topic needs.
Every box and arrow updates as you type, wrapping longer sentences automatically so the layout stays readable at any length.
Download the diagram as SVG for editing later, or PNG for pasting straight into a worksheet, slide deck, or study guide.
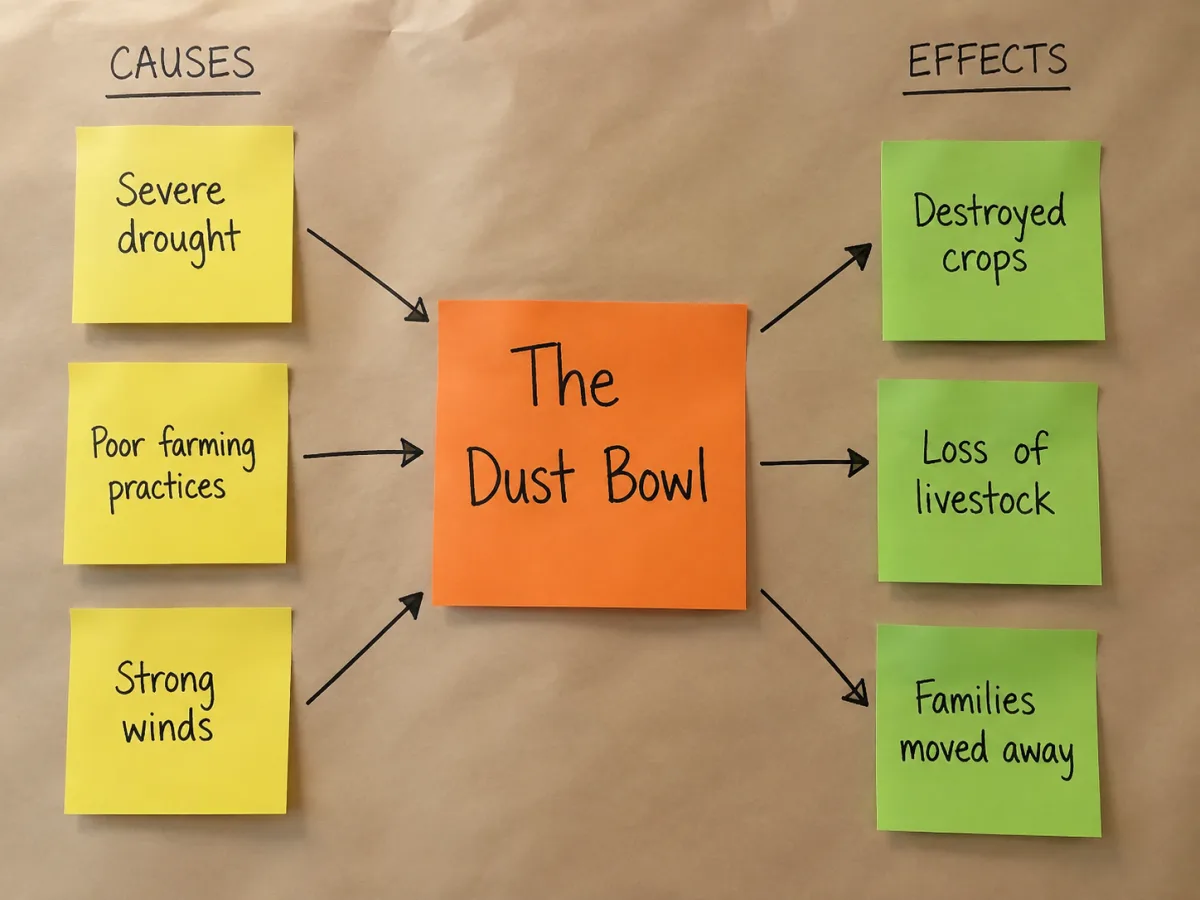
Words like because, since, as a result, therefore, and consequently signal a cause and effect relationship before a reader even reaches the sentence's meaning. Pair this organizer with a passage: have students underline the signal word first, then sort what comes before it into a cause box and what comes after into an effect box.
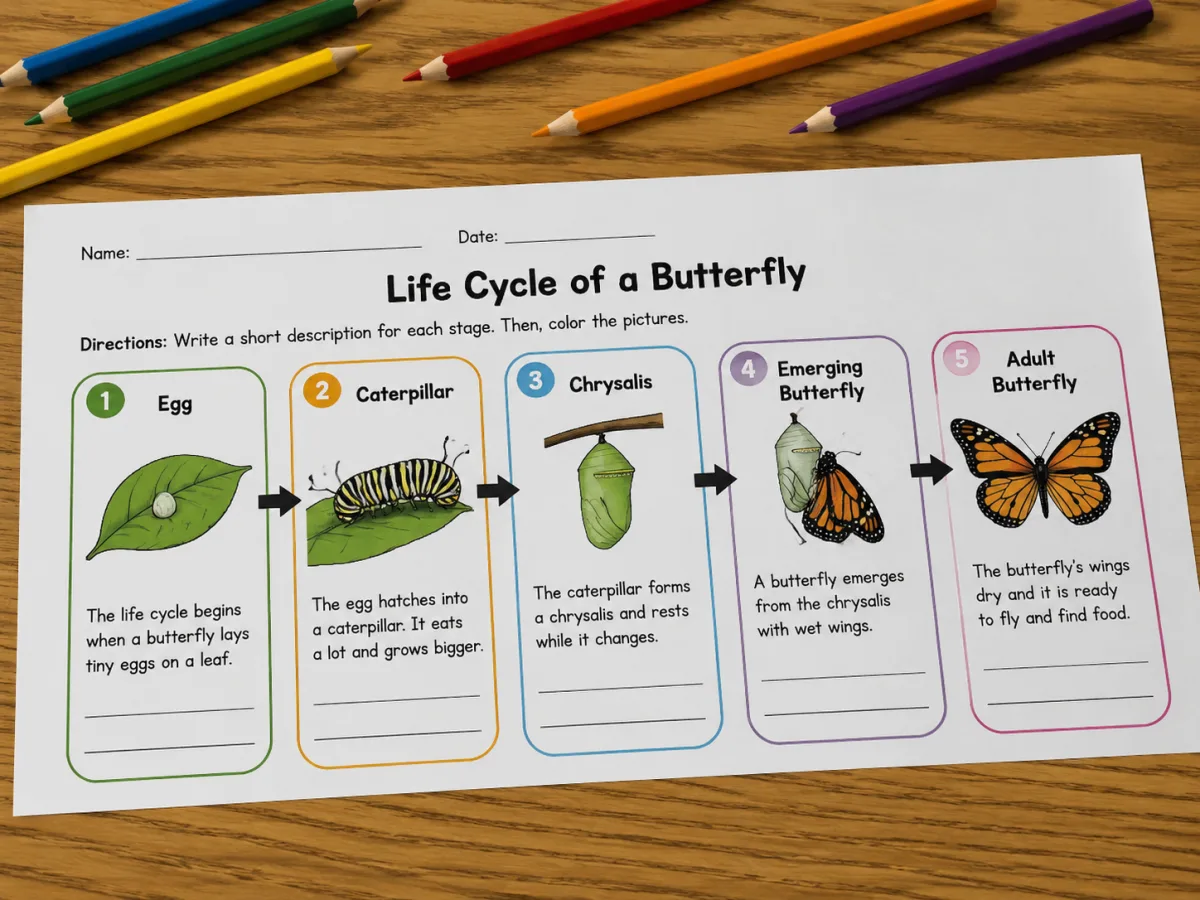
Use the multi-cause layout when one event has several drivers or several consequences worth showing side by side, like a historical event or a natural disaster. Use the chain layout when the real structure is a sequence — a life cycle, a process, or a story retold in order — so effect becomes cause for the next step.
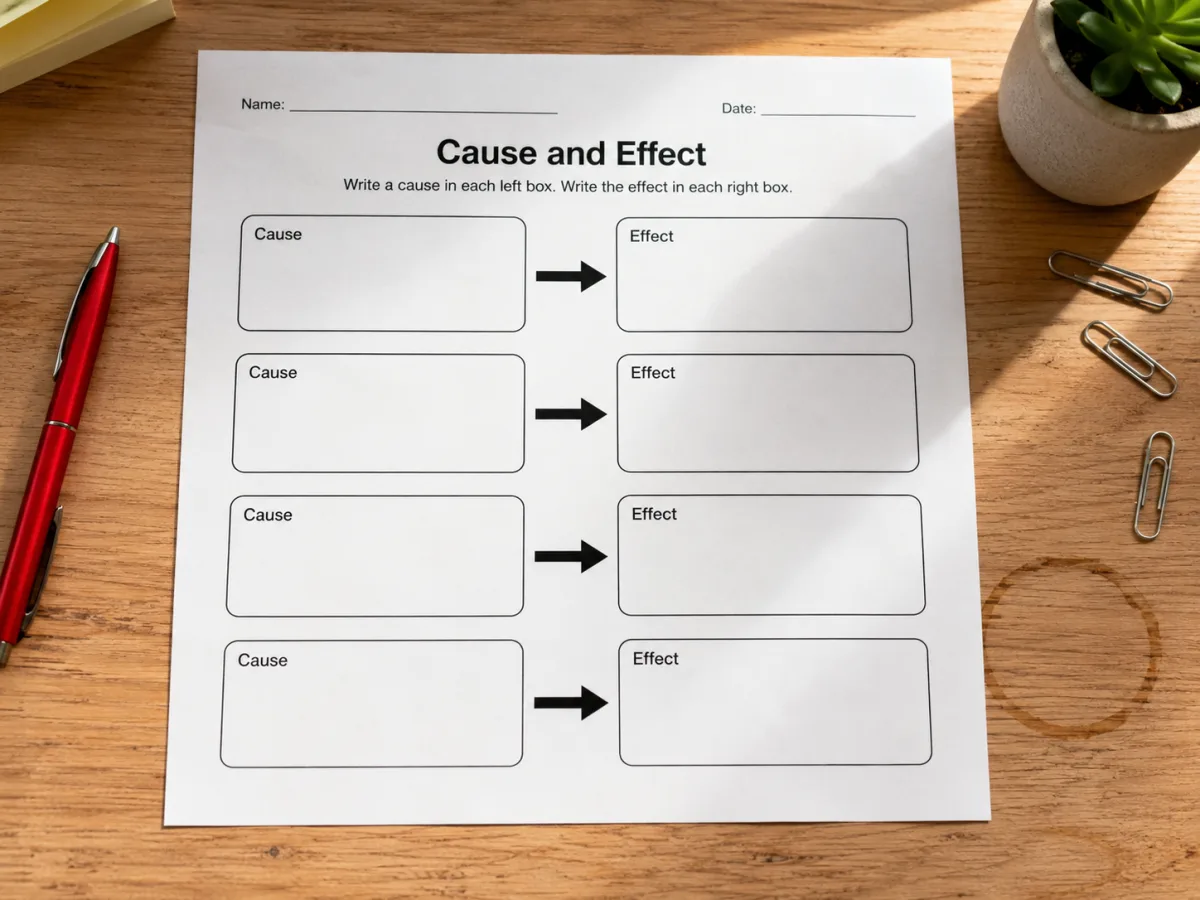
Every diagram exports as a clean SVG or PNG, sized to print on a single page. Leave a few boxes blank before exporting to hand students a fill-in-the-blank worksheet, or fill in every box for an answer key.
Answers to the questions people most often ask about cause and effect and this organizer.
Fill in an event, a chain, or both, and download a print-ready diagram — all in your browser.