

Paste your abstract and get a three-column visual abstract — Methods, Results, Conclusion — with icons and key numbers rendered right in the image.
A visual abstract is a single image that compresses a paper's methods, results and conclusion into one figure a reader can scan in seconds — built for a journal's social media feed, where a wall of text gets scrolled past.
The format most clinical and surgical journals recognize uses three columns, one for methods, one for results, one for conclusion, each carrying one icon-style illustration, a short label, and a single key number pulled straight from the abstract — a sample size, a percentage, a hazard ratio.
It is not a replacement for the written abstract; it is a companion figure that gives editors, reviewers and readers the paper's headline finding before they decide whether to read further.

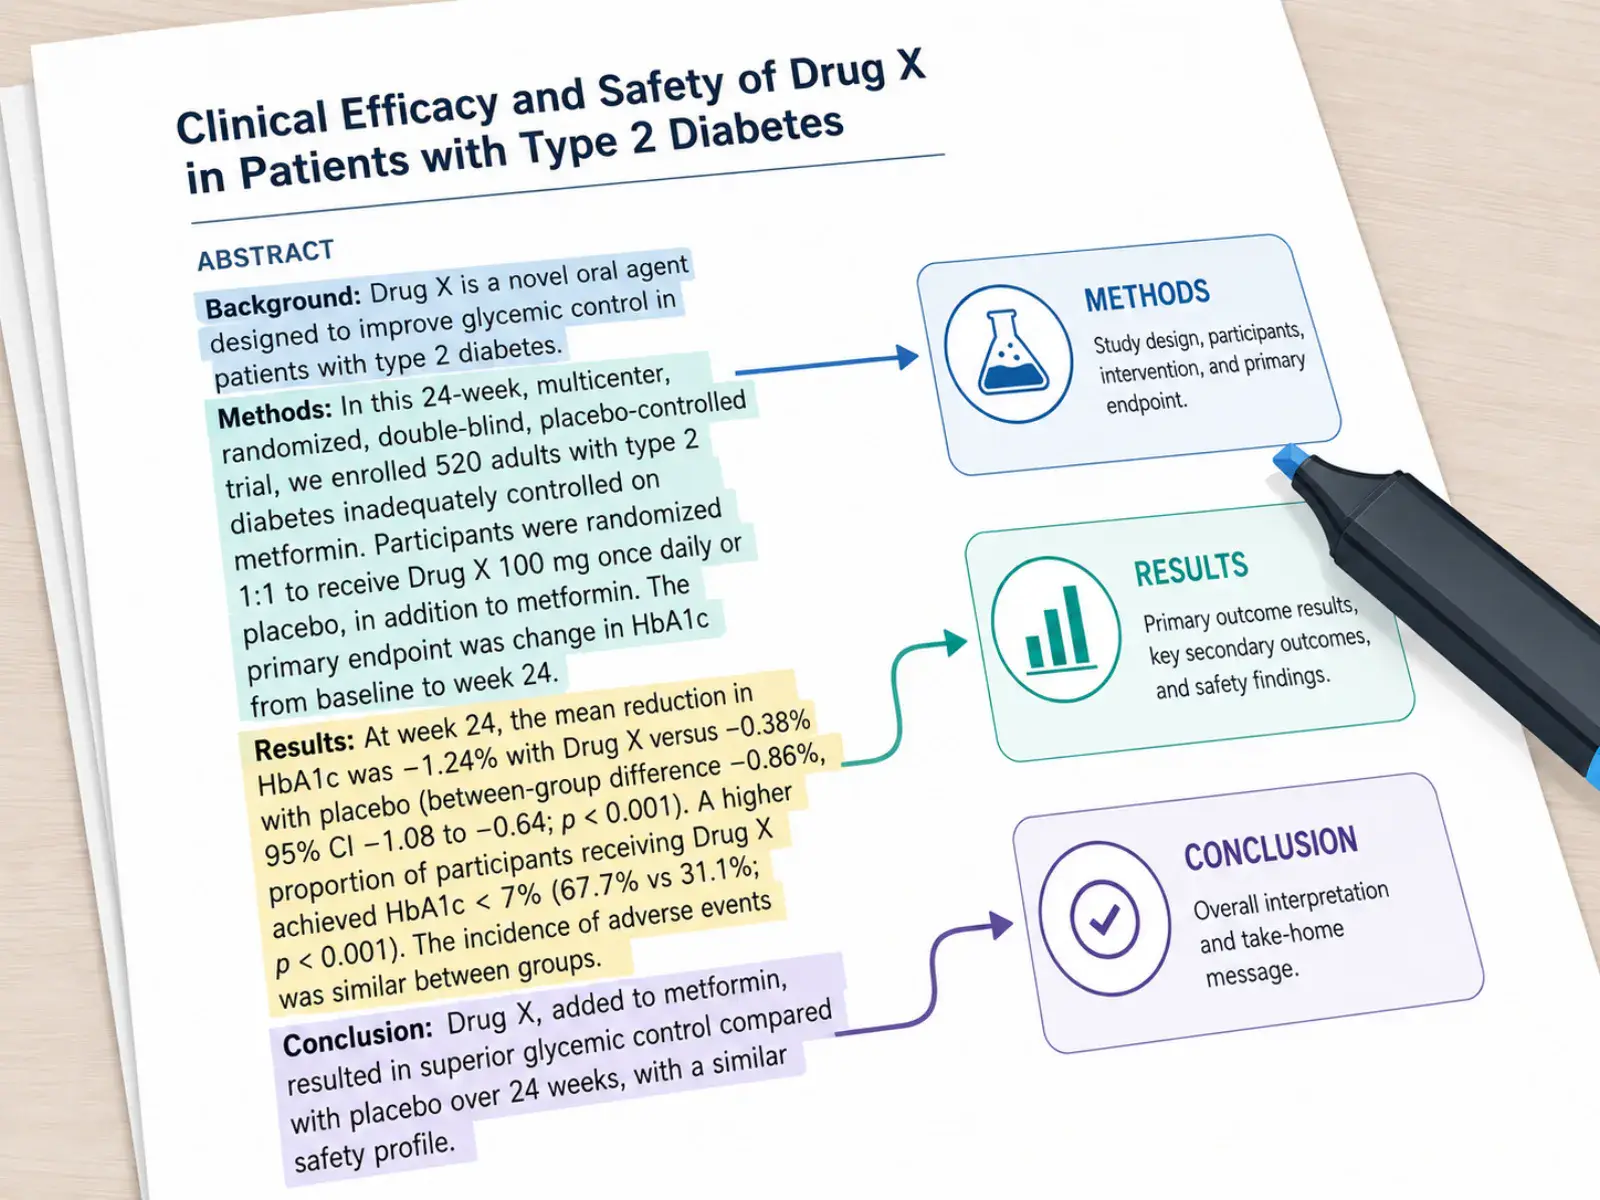
Paste the abstract and the visual abstract maker classifies each sentence by its methodological role, then lays out one column per section — no manual cropping or copy-pasting screenshots of your own figures.
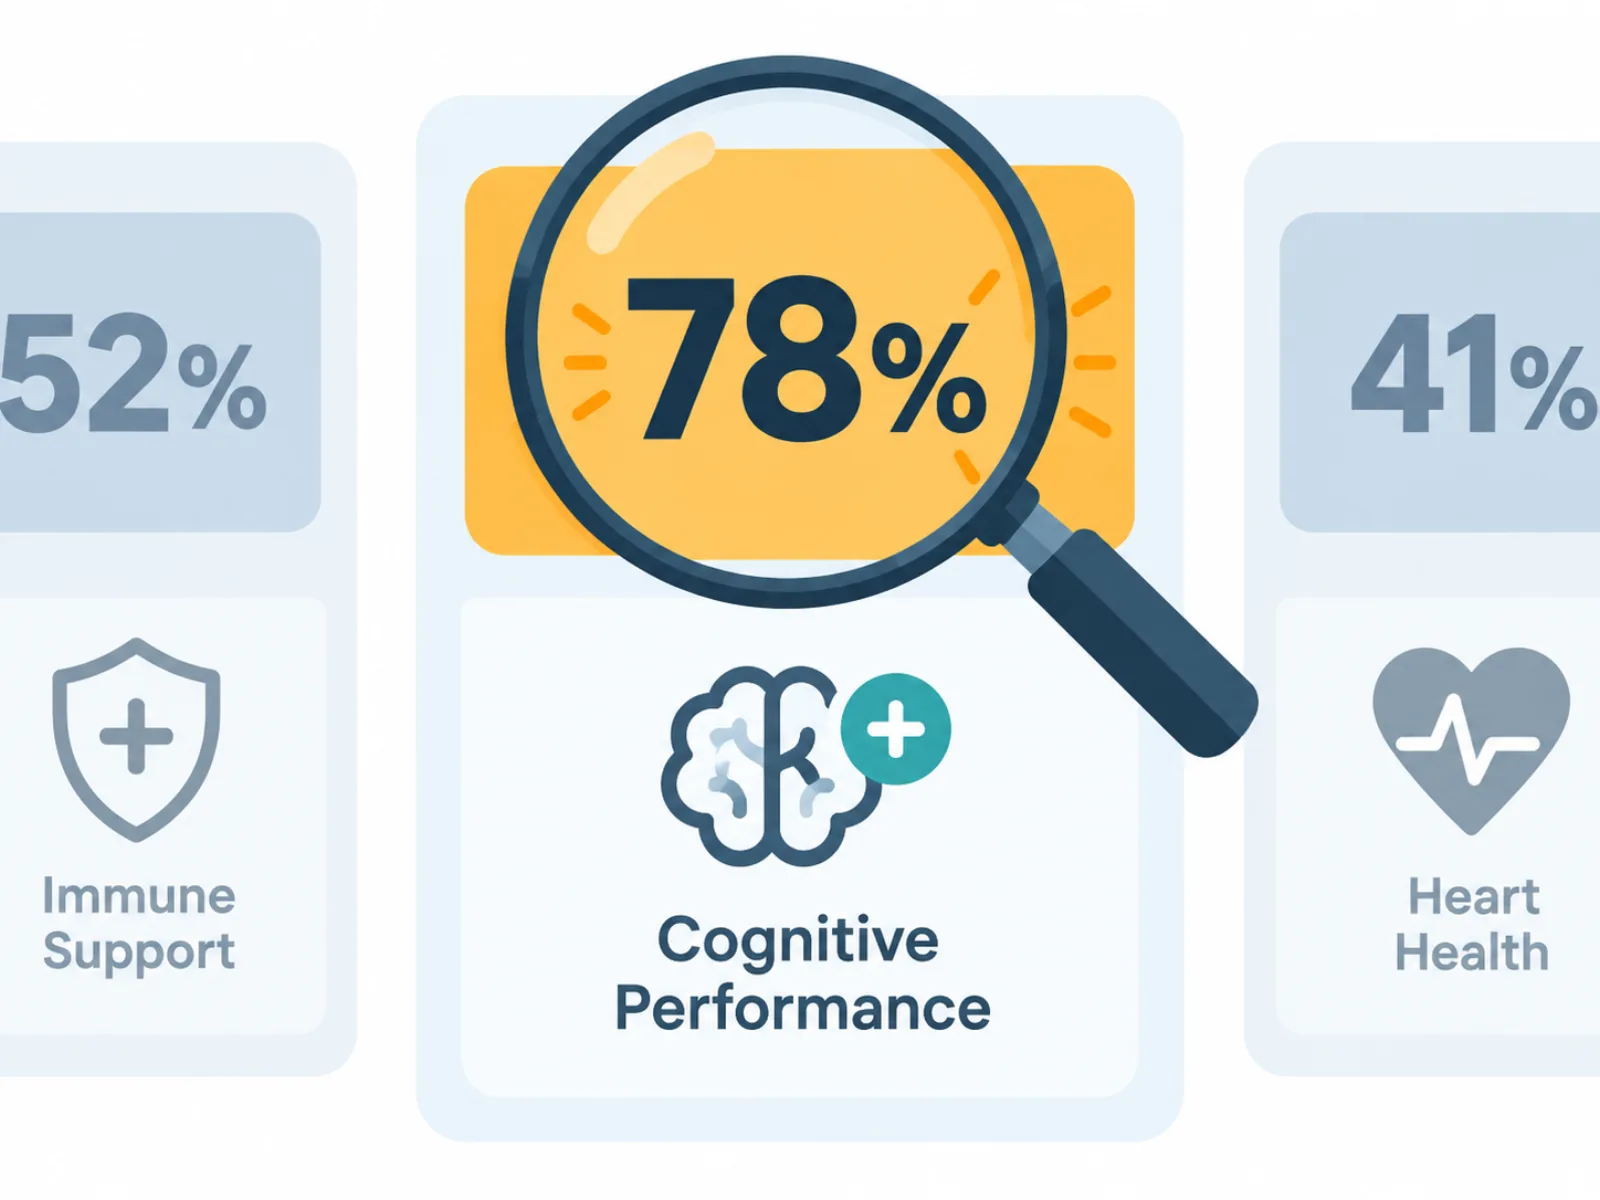
A sample size, a percentage-point change, a hazard ratio — the generator pulls one concrete statistic per column and renders it in large bold type, so the number stays legible even at thumbnail size on a social feed.
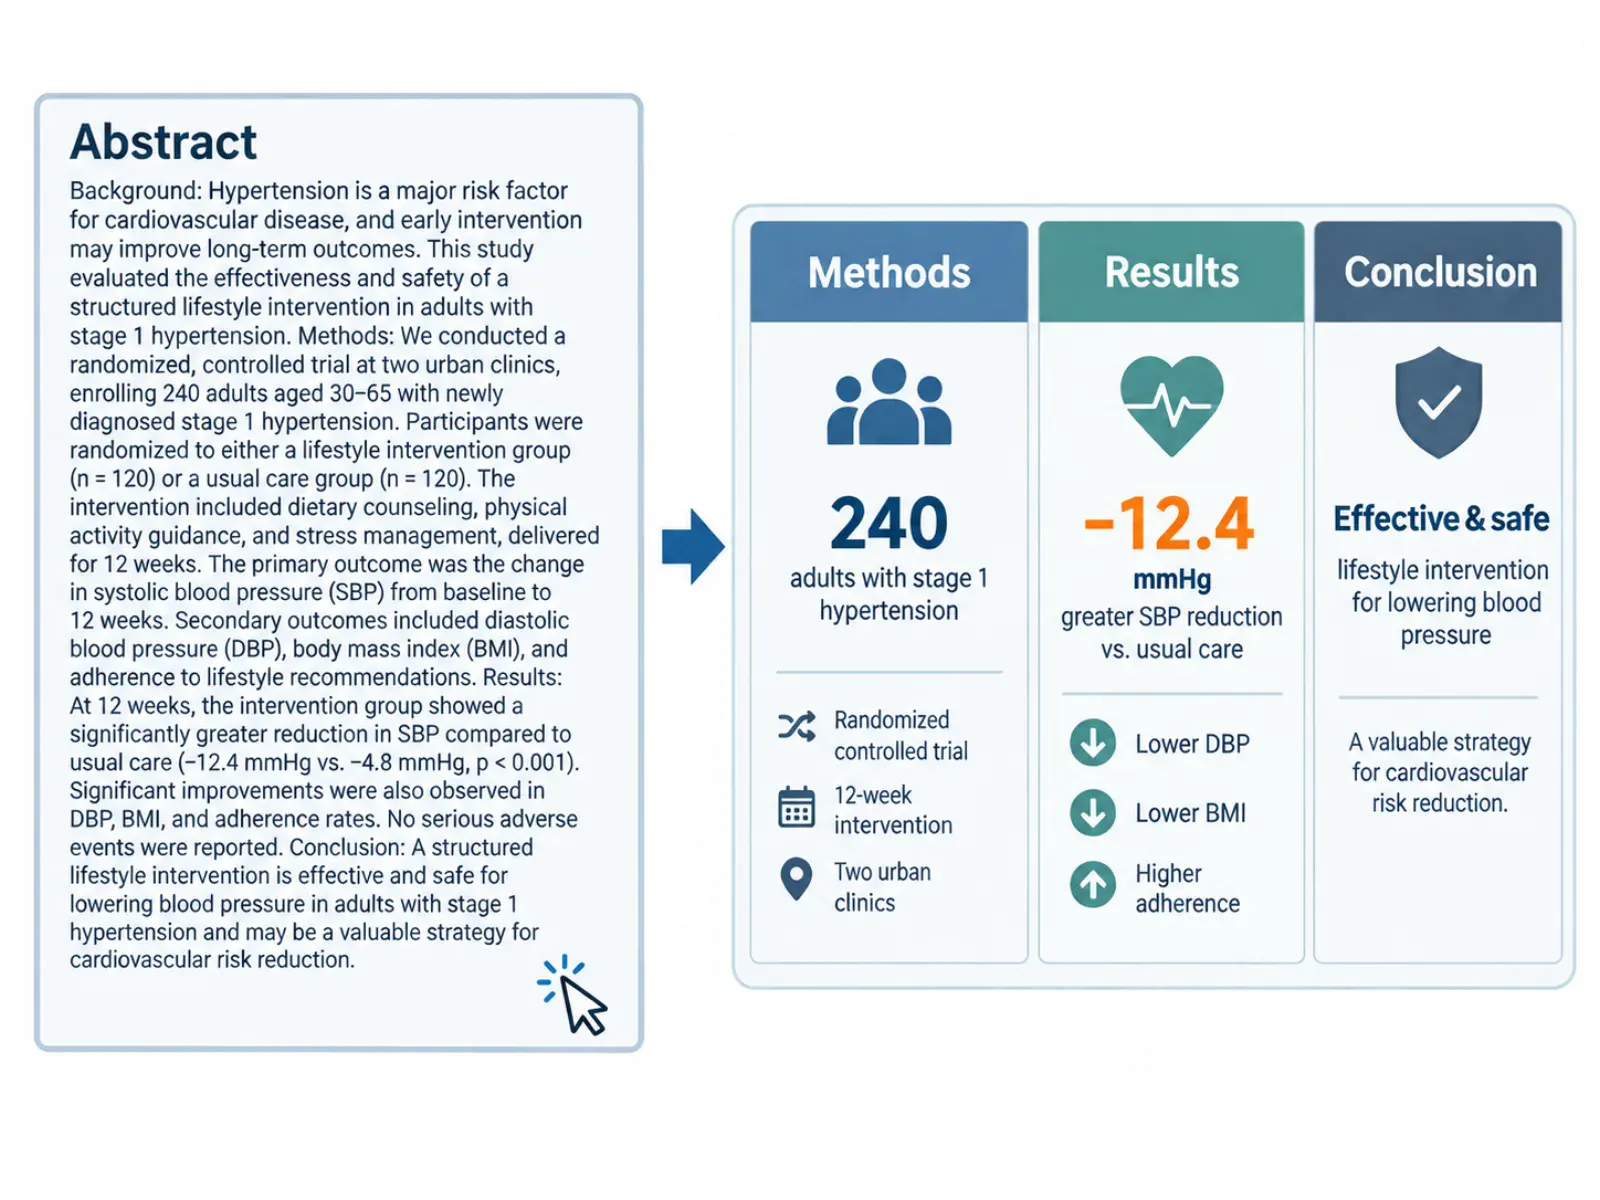
No diagramming tool to learn. Paste the abstract the way it appears in your manuscript, and the generator infers the icons, labels and layout — sized for a journal figure or a social post.
The two terms get used interchangeably, but they describe different formats with different origins and different journal requirements.
Fixed three columns: Methods · Results · Conclusion
Open panel count, background to findings
Four starting points from clinical trials, public health, surgery and nursing — every column carries a real number from its abstract.
A GLP-1 agonist trial in 412 adults with type 2 diabetes, with the HbA1c reduction and target-reached percentage rendered as key numbers.
An AI-assisted mammography cohort of 28,600 women, with detection sensitivity and recall rate rendered as the key numbers.
A laparoscopic versus open appendectomy cohort of 950 patients, with hospital stay and infection rate rendered as the key numbers.
A nurse-led fall-prevention bundle across 6,200 admissions, with the fall-rate reduction rendered as the key number.
Three steps from a pasted abstract to a downloadable three-column figure.
Copy the abstract from your manuscript or preprint — the same text you would submit to a journal.
The visual abstract maker classifies the text into methods, results and conclusion, and pulls one key number into each column.
Confirm each rendered number matches your abstract, then download the image for your journal submission or your lab's social feed.
* Exports high-resolution PNG.
Format and journal-requirement questions answered before you build your own.
* Exports high-resolution PNG.
Paste your abstract once and get a three-column visual abstract — sign up for free starter credits and try it.