

Describe the components and connections in your experimental setup and get a labeled schematic diagram — an apparatus or system diagram for your paper, not a circuit.
Four apparatus and system layouts, from a single reaction flask to a multi-sensor sampling line.
Round-bottom flask, heating mantle, reflux condenser, and collection vessel connected in the correct order, with the inert-gas line labeled separately from the vapor path.
Laser source, beam splitter, mirrors, and detector laid out along the beam path, with each optical element labeled and the beam direction marked by arrows.
Syringe pumps feeding a microfluidic chip through labeled inlet channels, with the mixing junction and outlet reservoir connected in flow order.
Air intake, filter housing, pump, and flow meter connected in sequence, with sampling ports labeled at each collection point along the line.
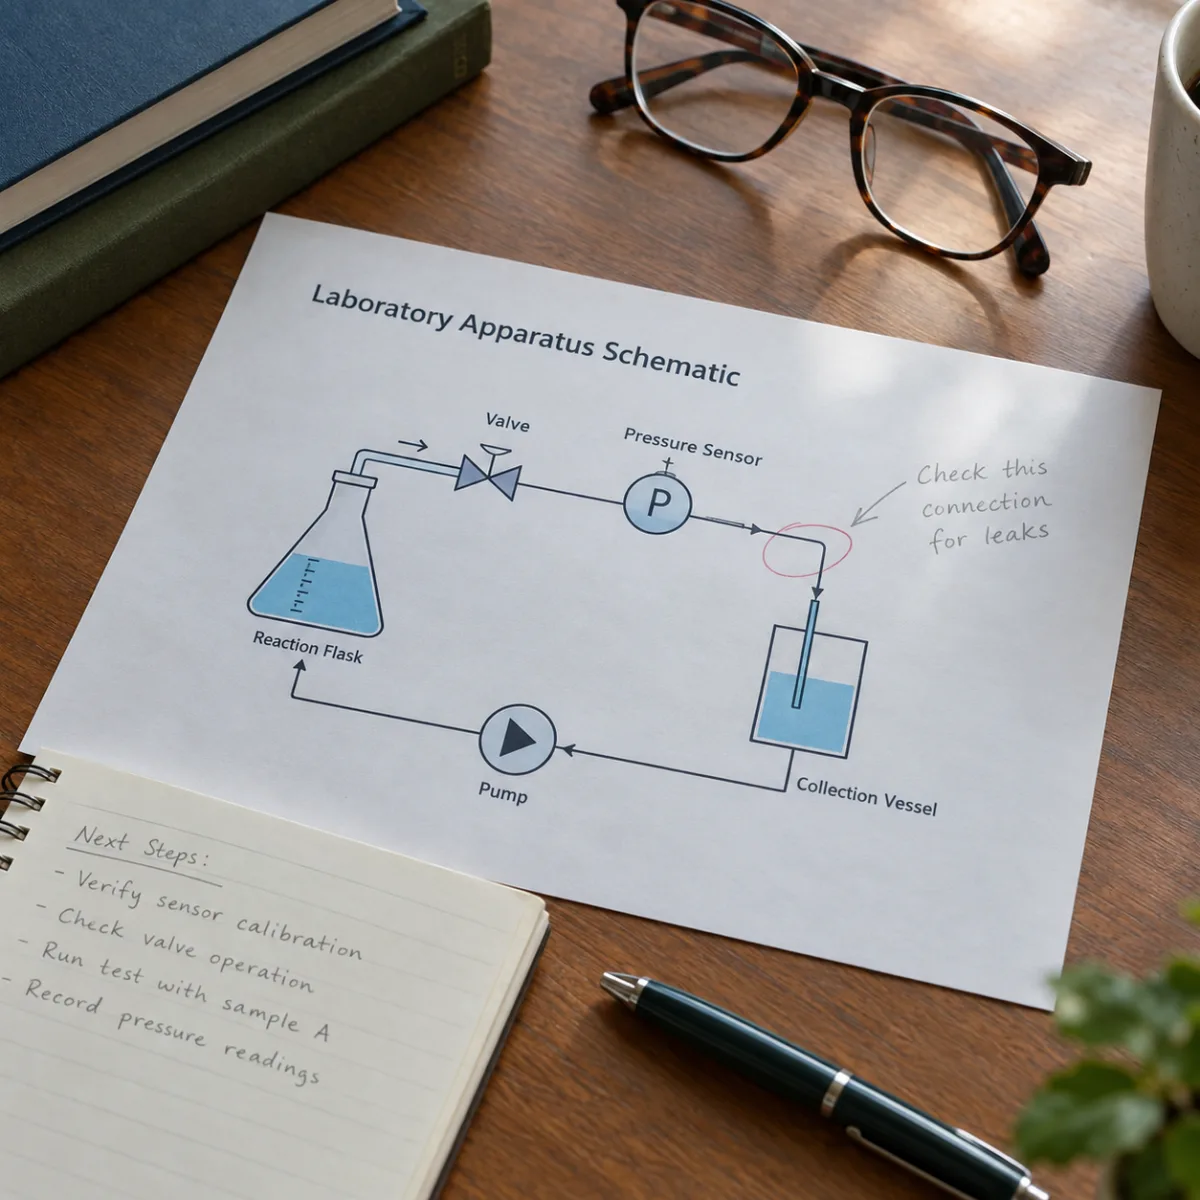
A schematic diagram represents a physical setup as simplified shapes and connecting lines instead of a realistic drawing — a flask becomes a circle, a valve a triangle, a sensor a small labeled box — with a line or arrow showing how fluid, signal, or force moves between them.
In electronics, "schematic" almost always means a circuit diagram of resistors, capacitors, and wires. In a research paper it usually means something broader: an apparatus, reactor, optical bench, or sampling line, drawn as labeled parts connected in the order they were actually plumbed or wired together.
If you're documenting a circuit board or a microcontroller pinout, a dedicated electrical-schematic tool with standard IEC/ANSI symbols will serve you better than this one — this generator is built for apparatus and system layouts, not resistor-capacitor networks.
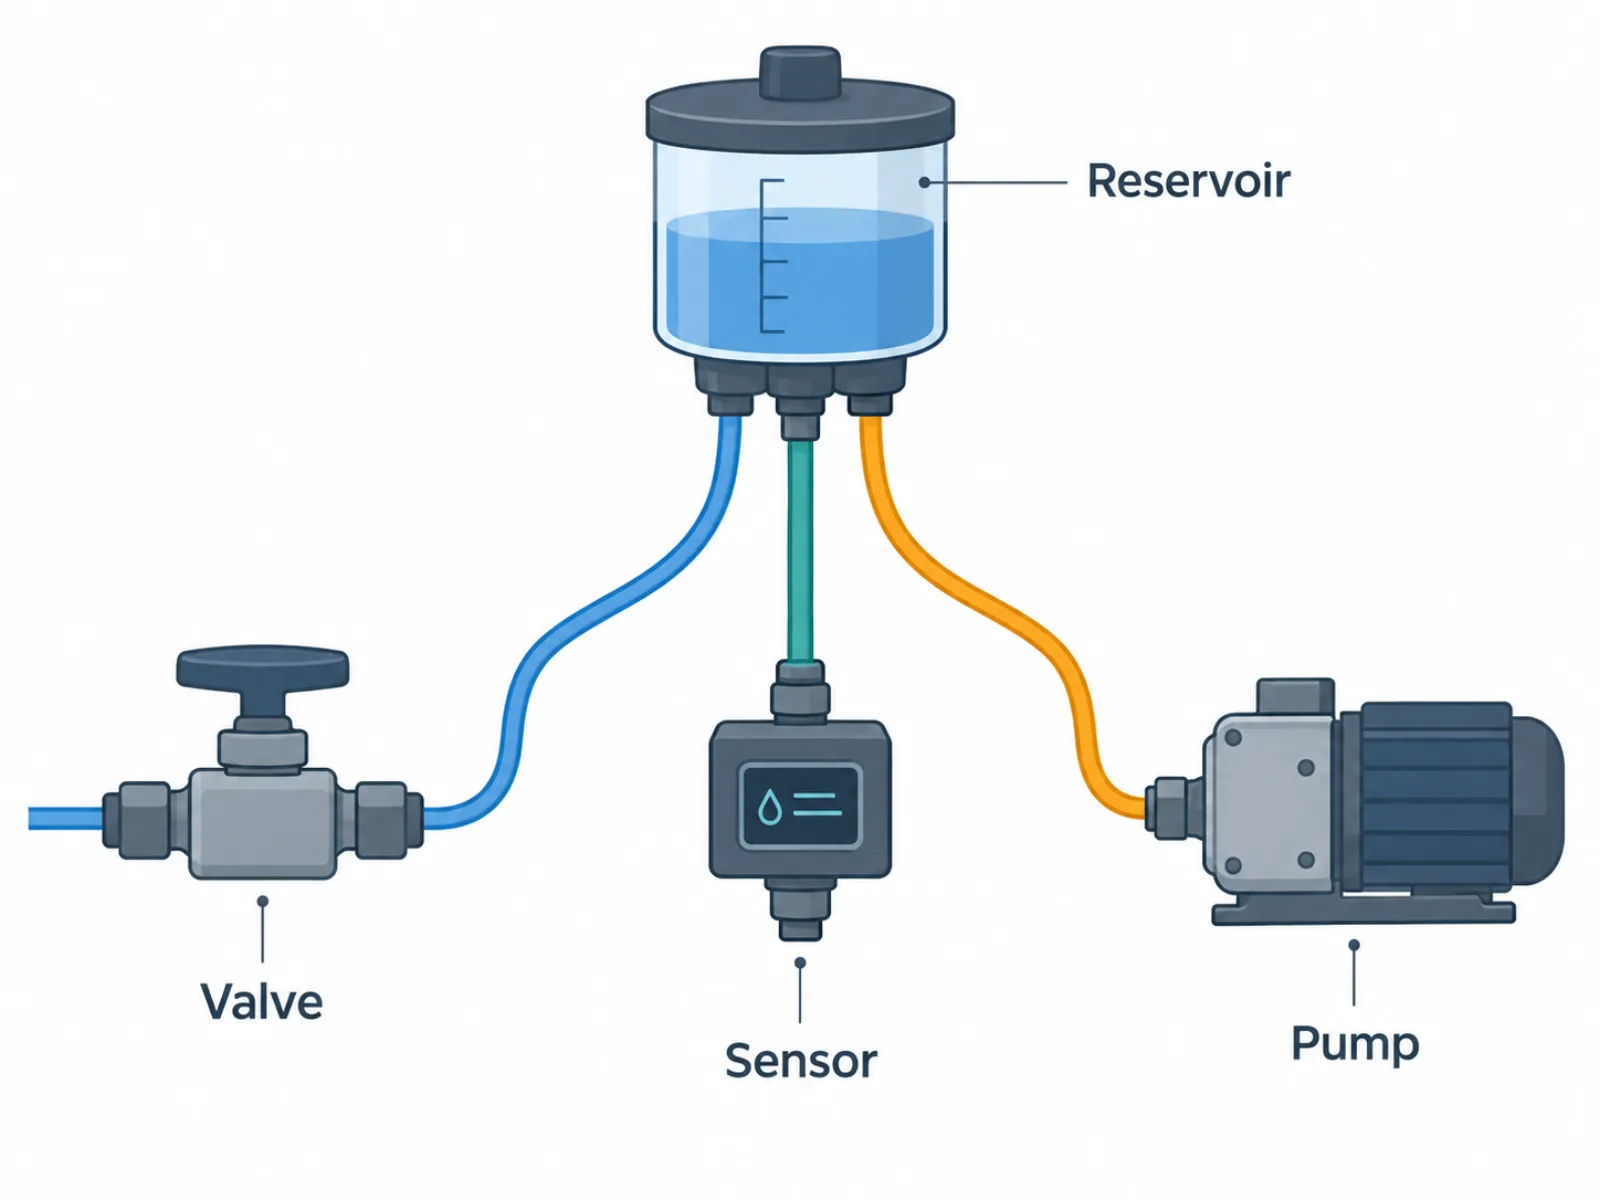
The generator draws exactly the connections you describe — which vessel feeds which line, which sensor sits on which branch — instead of a generic layout that looks right but wires the wrong parts together.
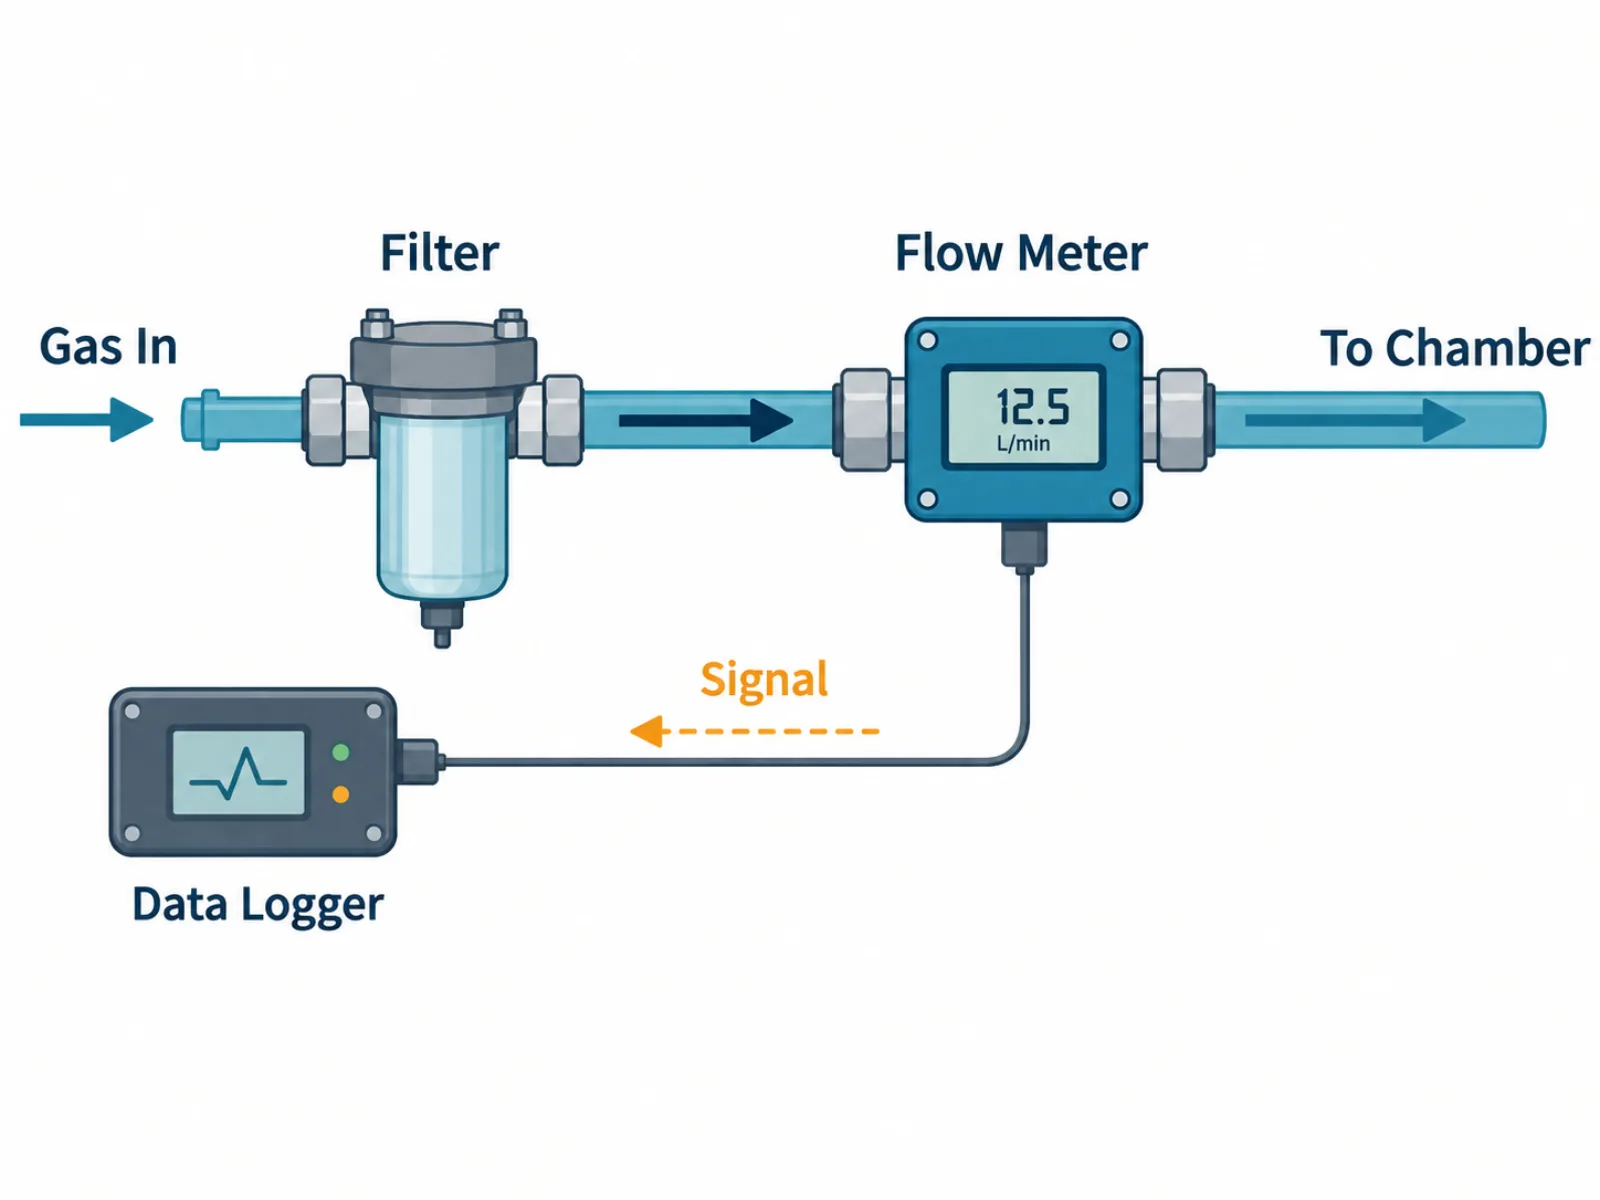
Liquid flow, gas flow, and signal or data paths each get a directional arrow matching your description, so a reader can trace material or information through the setup without guessing which way it moves.
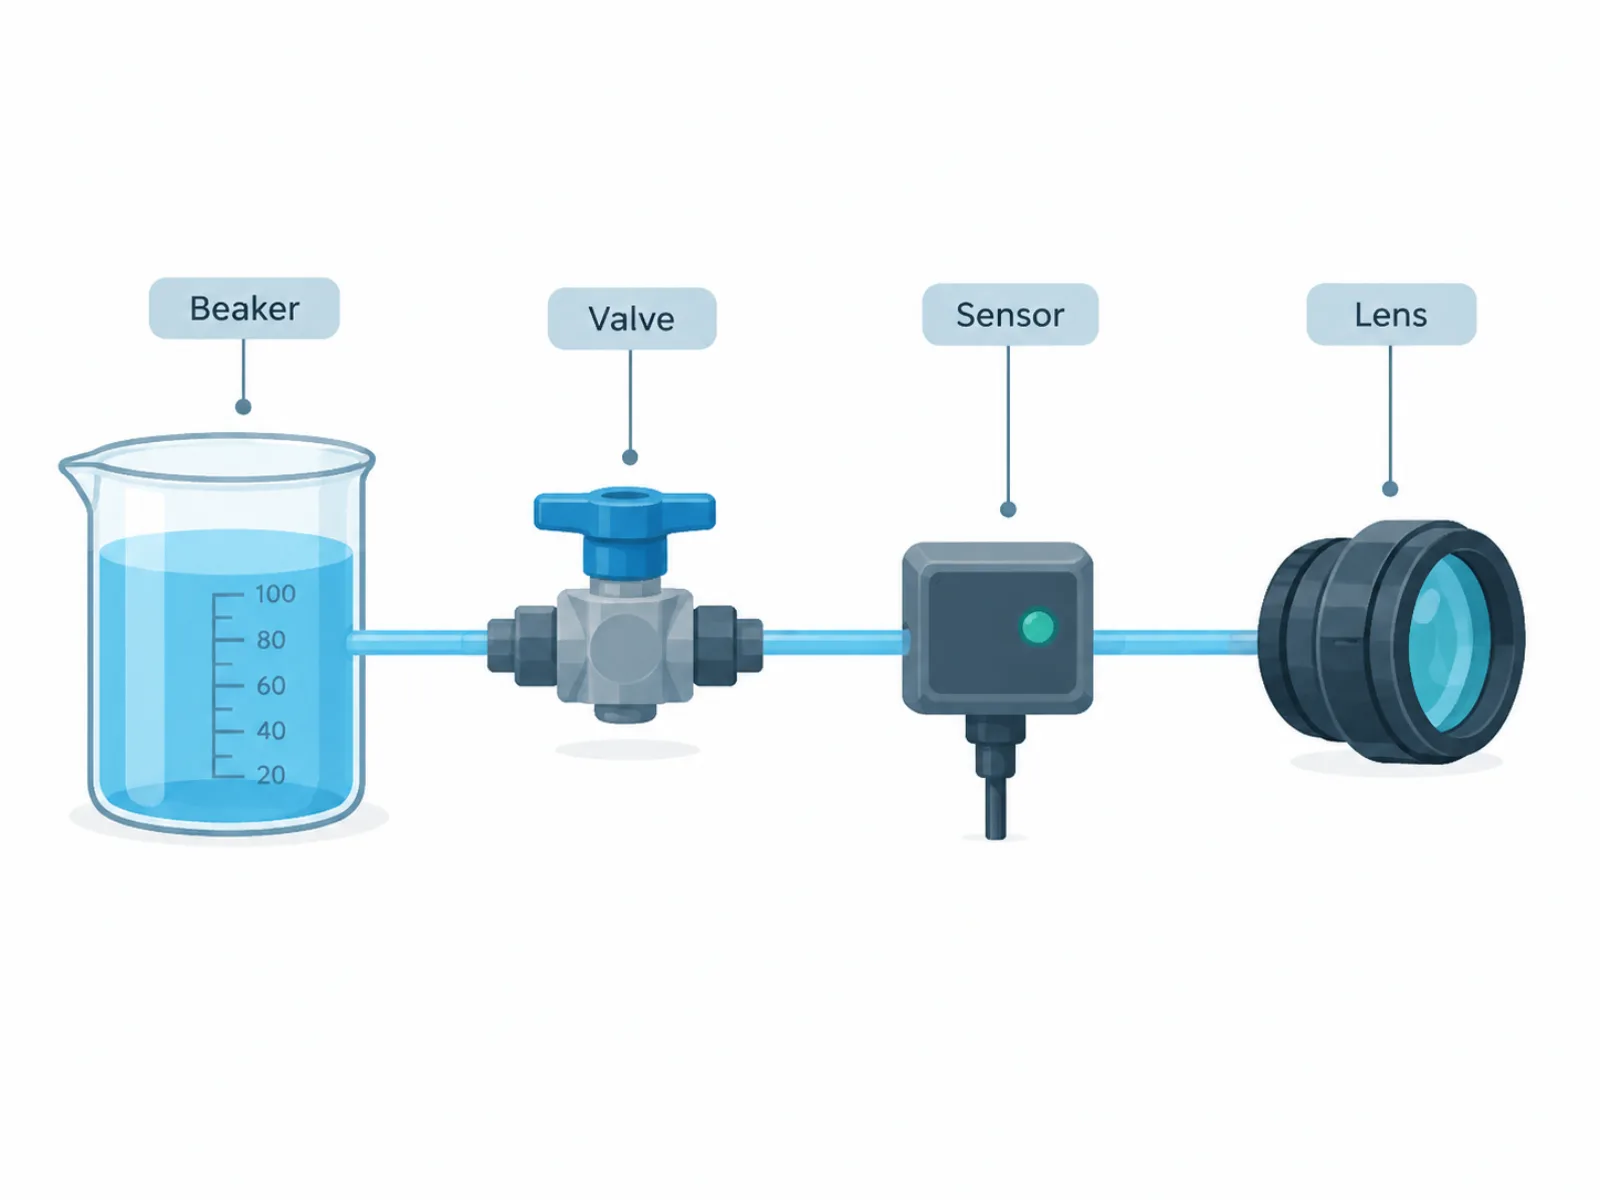
Each vessel, sensor, valve, or optical element gets a 1-3 word label placed next to it — enough to identify the part in a figure caption without cluttering the diagram with full sentences.
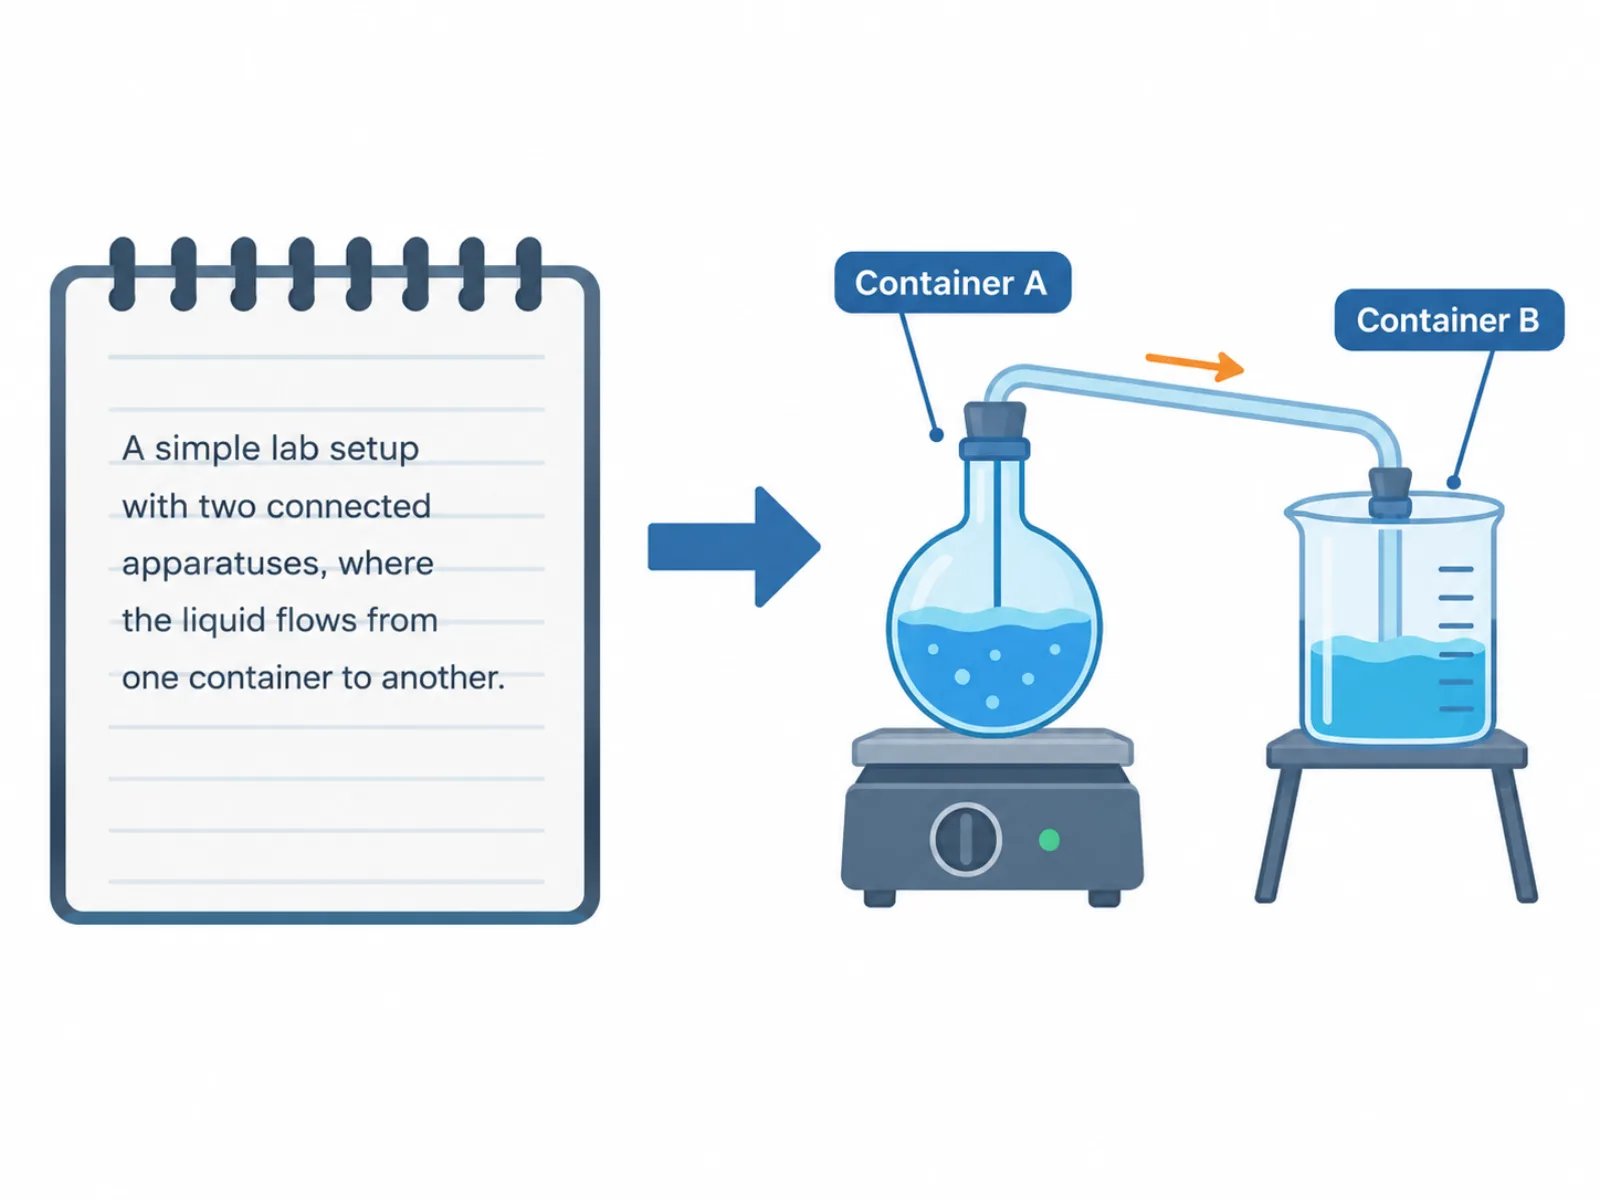
No node-and-connector editor to learn. Describe the apparatus the way you would to a labmate — what's connected to what, in what order — and the schematic diagram maker lays out the shapes and arrows for you.
Four steps from a setup description to an exportable diagram.
List the components in order and how they connect — which vessel feeds which line, which sensor attaches to which branch, and which direction flow or signal travels.
The schematic diagram maker reads the description and places each component as a labeled shape, connected exactly as described.
Confirm every line matches your actual setup and every label is legible, and regenerate if a connection or flow direction reads wrong.
Download the schematic as a high-resolution image and drop it straight into your paper, poster, or lab report.
* Exports high-resolution PNG.
All three simplify a real system, but they answer different questions — and a technical drawing adds a layer of dimensional precision that neither diagram type attempts.
How the parts physically connect
How the subsystems functionally relate
Questions answered before you draw your own.
* Exports high-resolution PNG.
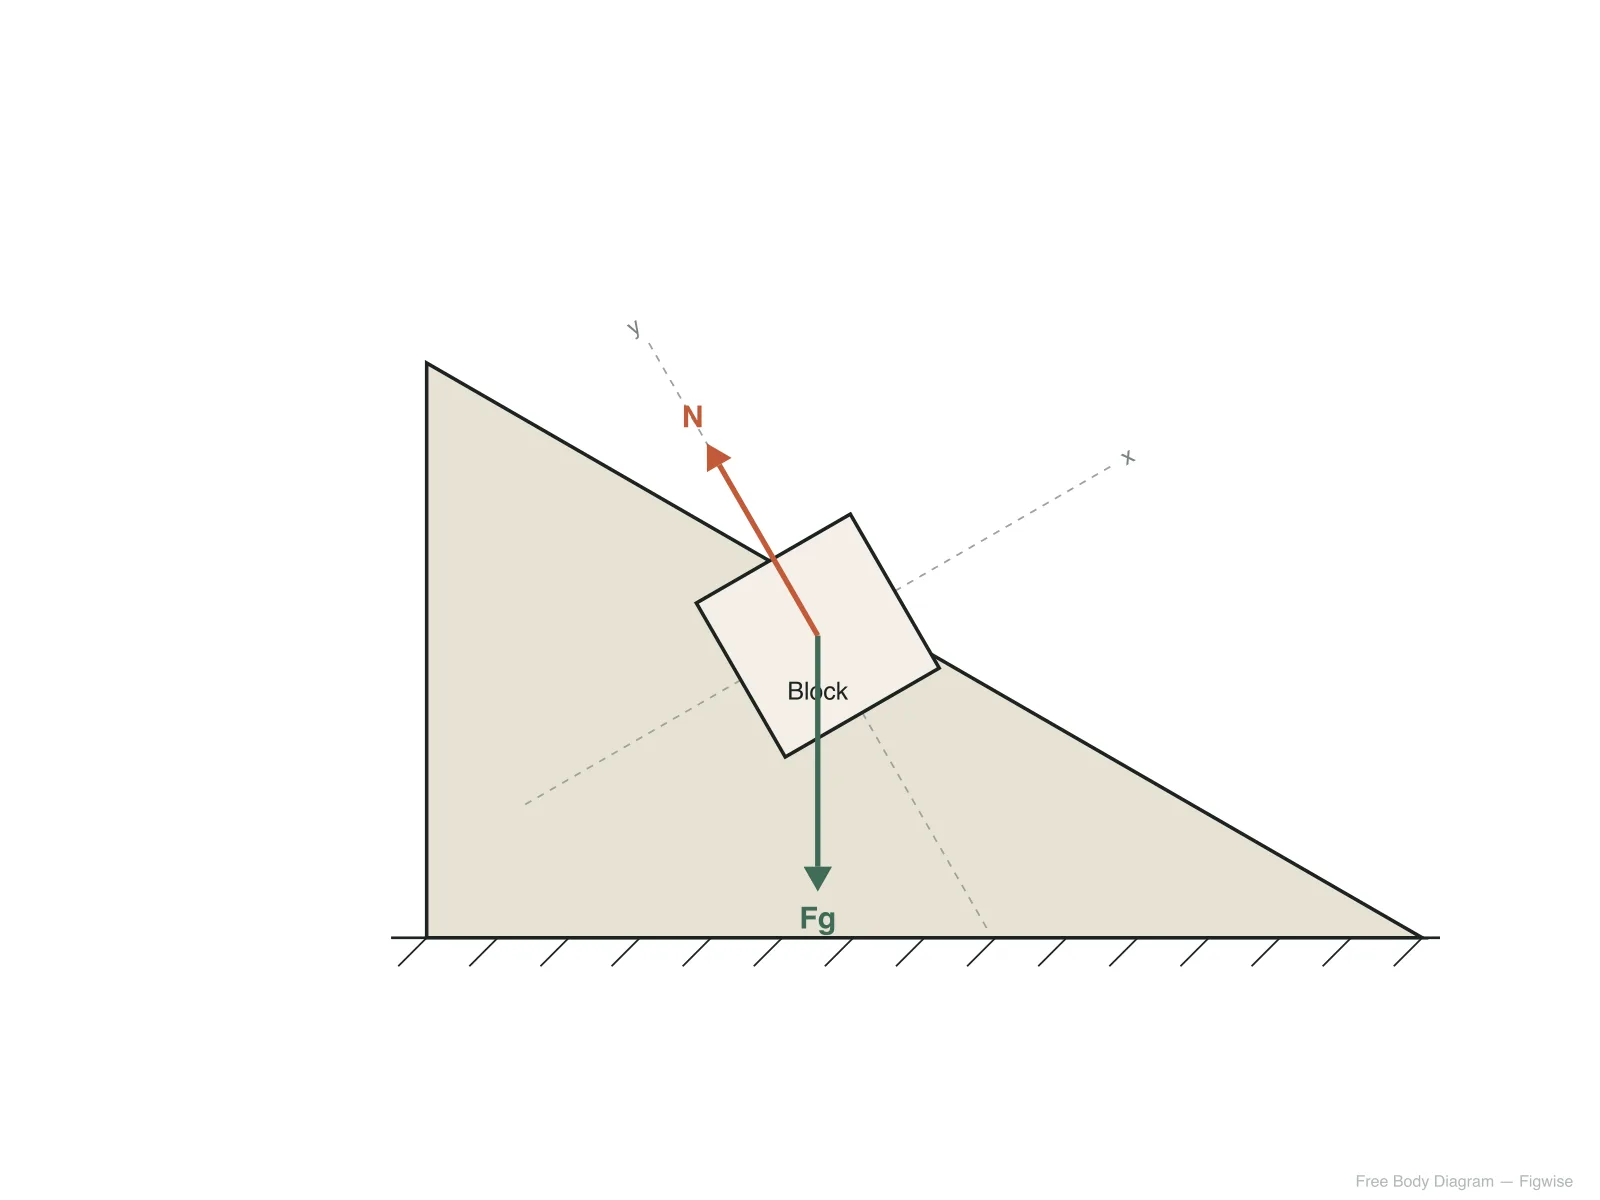
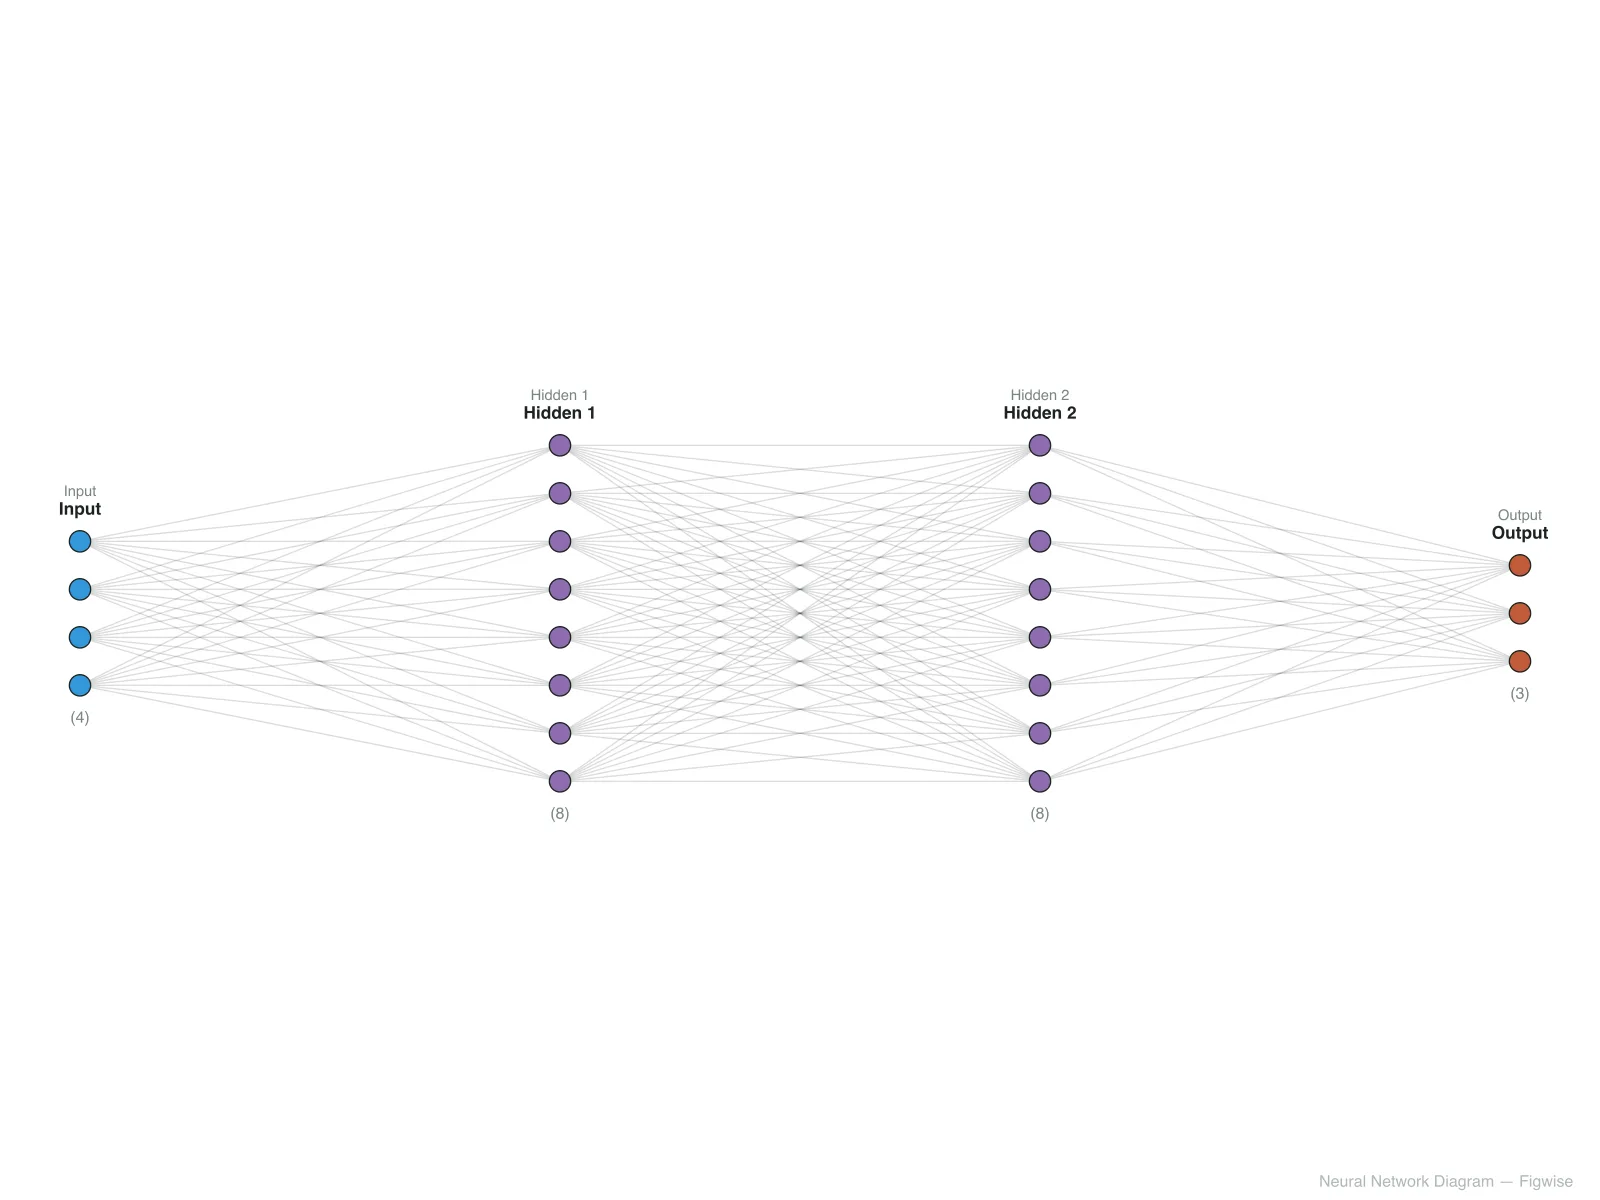

Describe your apparatus or system once and get a labeled schematic diagram, ready for your Methods section or presentation.