

Type an indented list of taxa or paste bracket notation, and this cladogram maker draws a right-angle branching diagram with every tip aligned — the layout biology courses expect, ready to export as SVG or PNG.
Four cladograms built with this cladogram maker, each showing a different way branching order communicates shared ancestry.
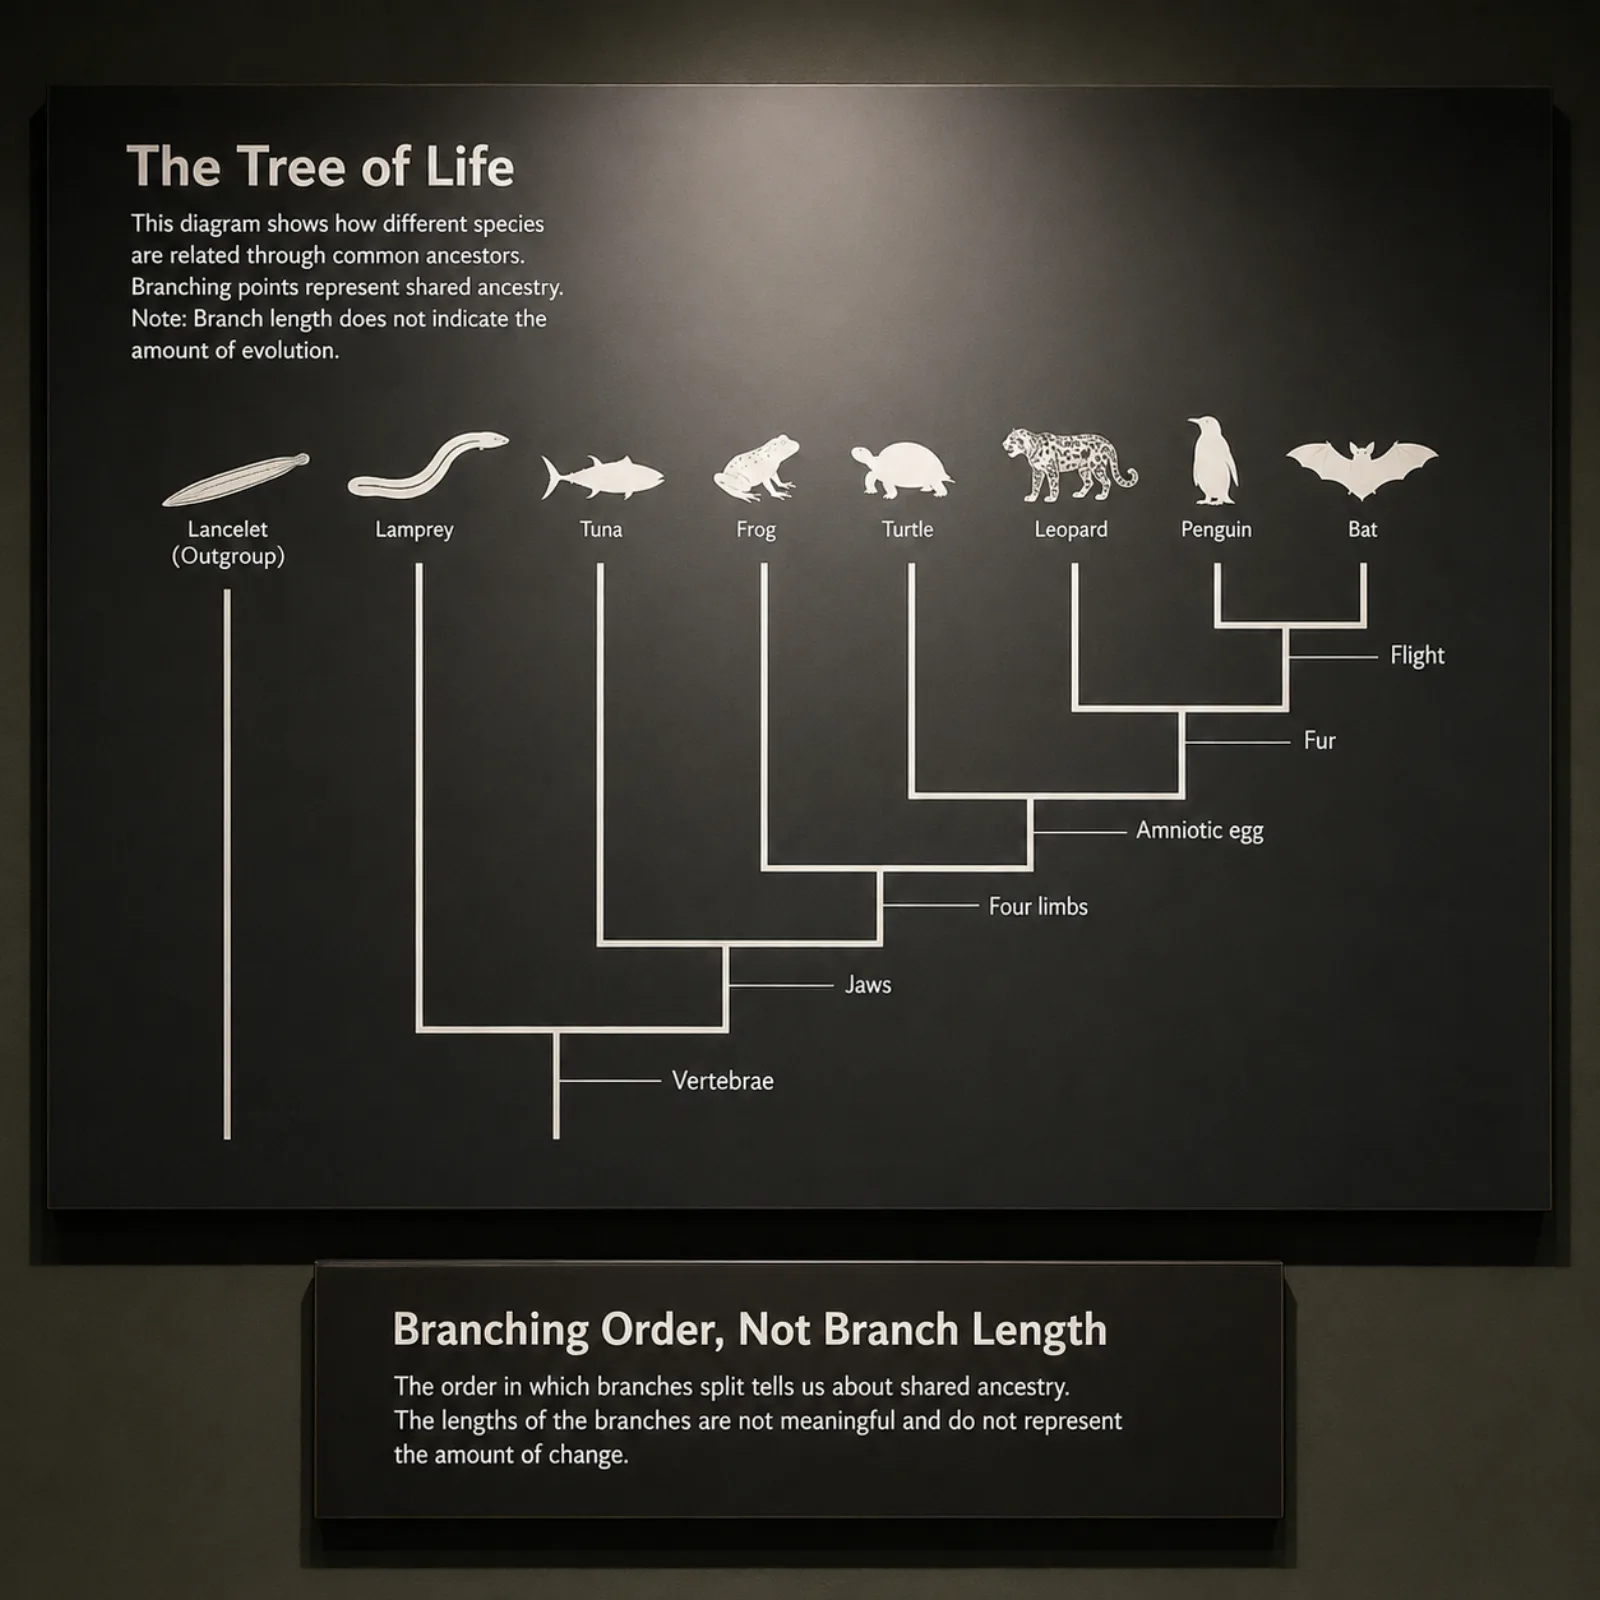
Fish, amphibians, reptiles, and mammals arranged by shared derived traits — four limbs, the amniotic egg, hair — each marked at the branch point where it first appears.
A botany-course cladogram grouping angiosperm families by inferred branching order, built from a plain indented outline with no molecular data required.
A textbook-style cladogram separating theropods, sauropods, and ornithischians, drawn from bracket notation pasted directly from lecture notes.
A compact cladogram of great apes and early hominins, with all tips flush at the right edge since branch length carries no meaning here.
A cladogram is a branching diagram that shows the inferred pattern of common ancestry among a group of organisms, without claiming anything about how much time or how much evolutionary change separates them. Each branch point, or node, represents a hypothetical common ancestor, and everything to the right of that node shares a derived trait — a synapomorphy — that organisms outside the group lack.
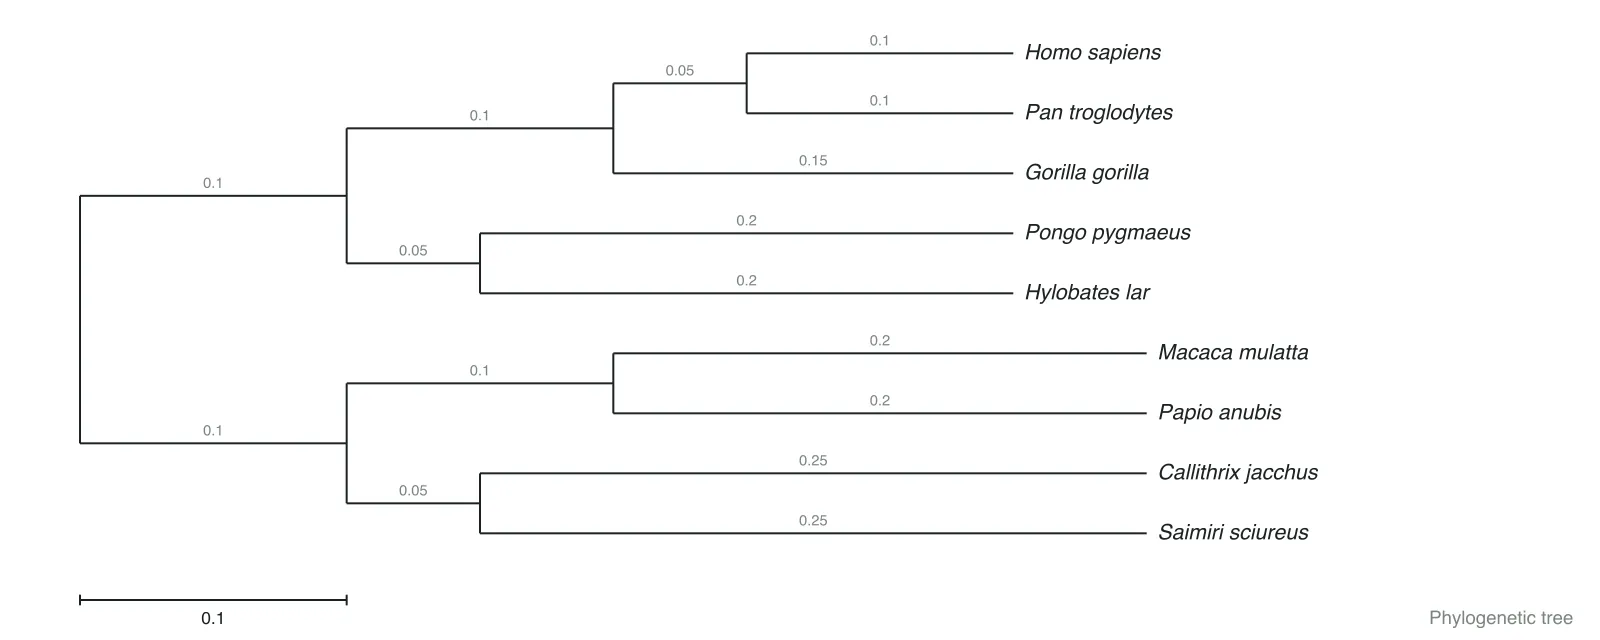
This is the single detail that trips people up when they first meet the term: in a cladogram, branch length is not meaningful. Two tips drawn far apart and two tips drawn close together can be equally related if they sit at the same branching depth. That is different from a phylogenetic tree (phylogram), where branch length is scaled to molecular distance or divergence time. A cladogram maker therefore draws every tip flush at the same edge — a right-angle, staircase layout — rather than stretching branches to a scale bar.
Cladograms are built from characters: morphological traits, behaviors, or in modern practice, molecular sequence data reduced to a strict parsimony or maximum-likelihood topology. Because the diagram only encodes topology, it is the standard teaching format for introducing cladistics — the method of grouping organisms by shared derived characters rather than overall similarity — before students move on to branch-length phylogenies.
Four steps from a list of taxa to an exportable diagram — no drawing software needed.
Type an indented outline (one taxon per line, deeper indentation means a more derived branch) or paste bracket notation such as (Fish,(Amphibians,Mammals)). Pick whichever matches how your source material is already written.
Append a shared trait in square brackets after a taxon name — for example, Amniotes [Amniotic egg] — and the cladogram maker draws a small tick and label at that branch point.
The diagram updates as you type, with every tip aligned at the same edge. Fix a misplaced clade by re-indenting a line or moving a bracket group — no coordinates to drag.
Download an SVG for a vector file you can relabel in Illustrator or Inkscape, or a 2× PNG sized for slides, handouts, and lab reports.
The two diagrams look similar, but the line that separates them is whether branch length carries information — and it changes how you should read one.
Branch length carries no meaning — topology only
Branch length proportional to evolutionary distance
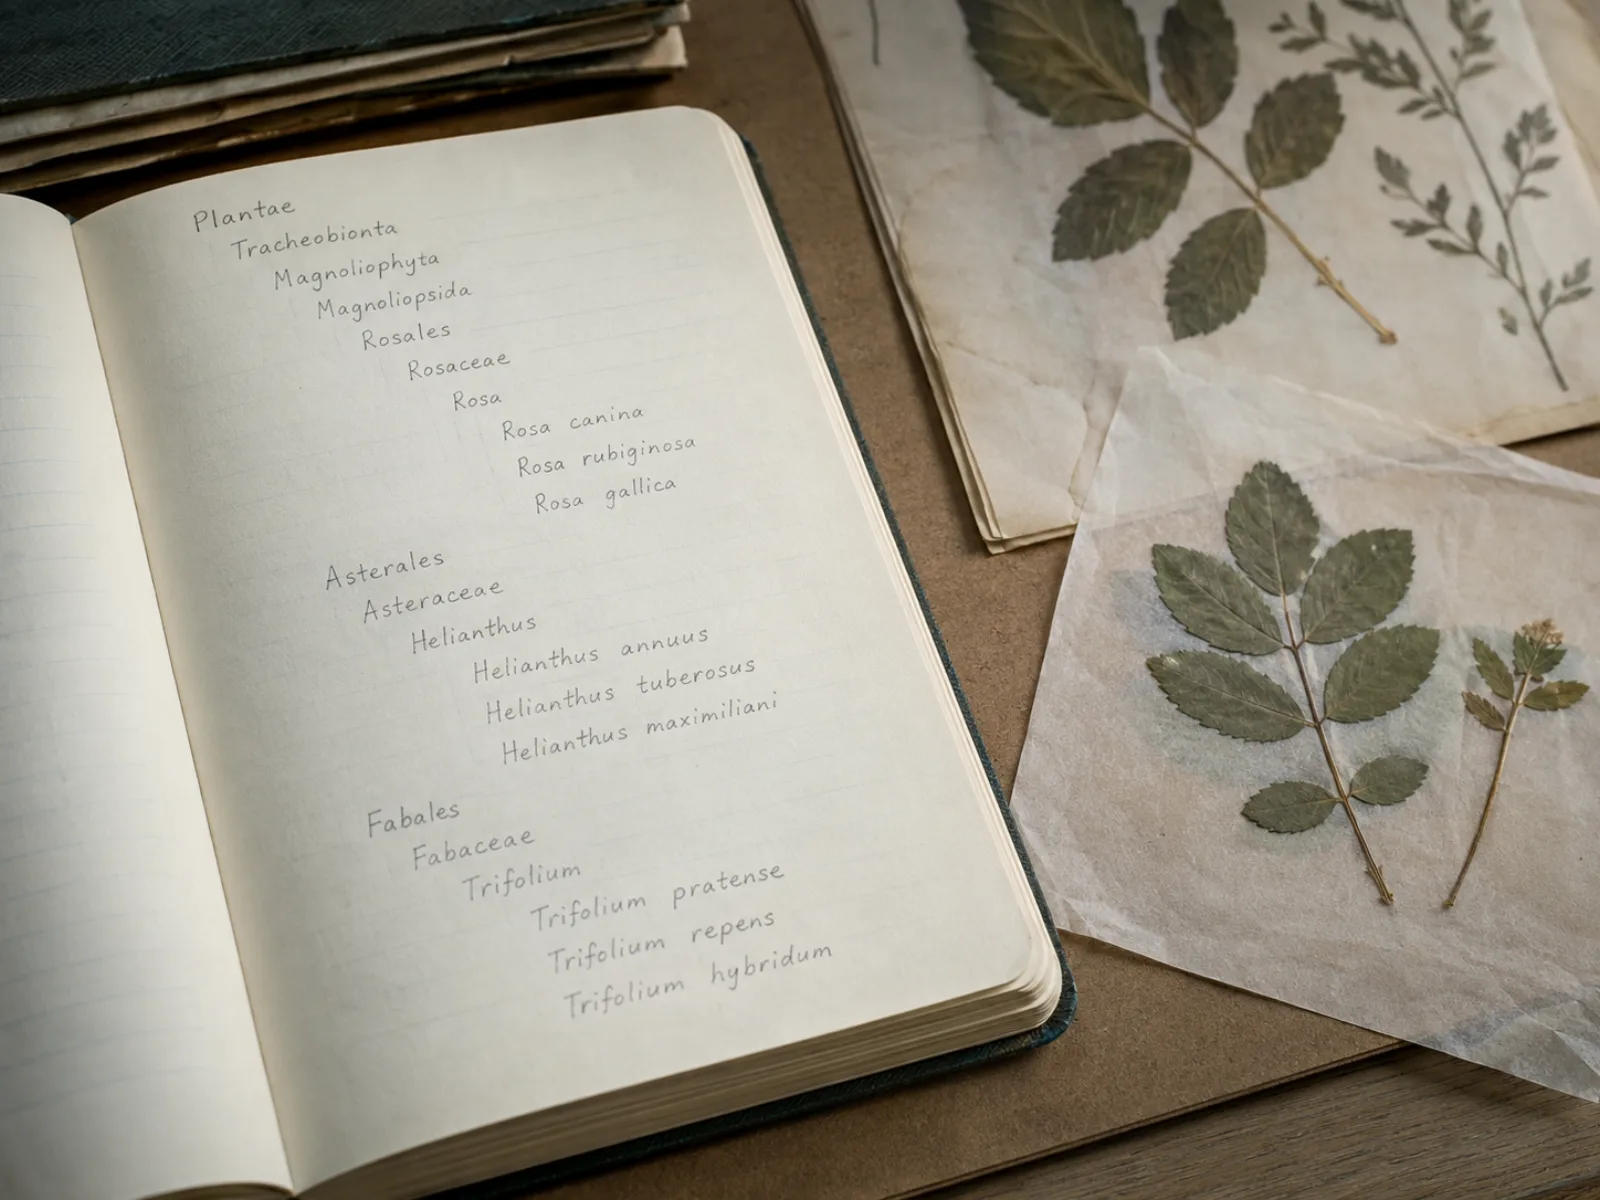
Most students and instructors do not think in nested parentheses — they think in outlines. Type one taxon per line and indent to nest a branch under its ancestor; the cladogram maker infers the tree structure from indentation alone, so a lecture-note outline becomes a diagram with no reformatting.
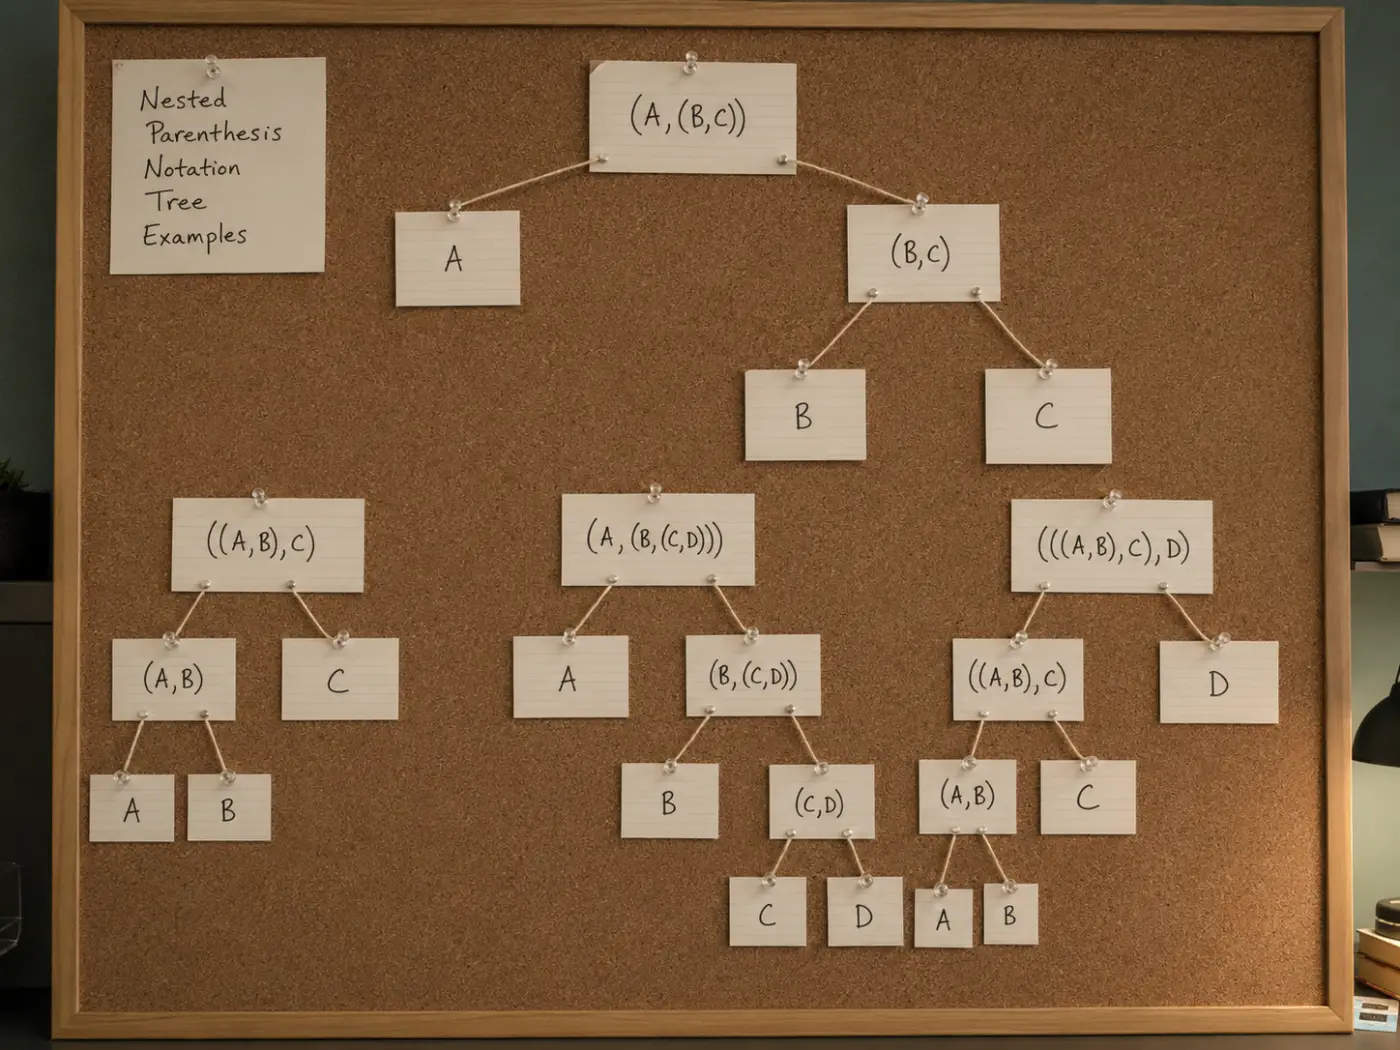
For deeply nested or copy-pasted topologies, bracket notation is faster to write than an outline. The cladogram maker parses standard nested-parenthesis grouping — no branch-length syntax to worry about, since a cladogram does not use it.
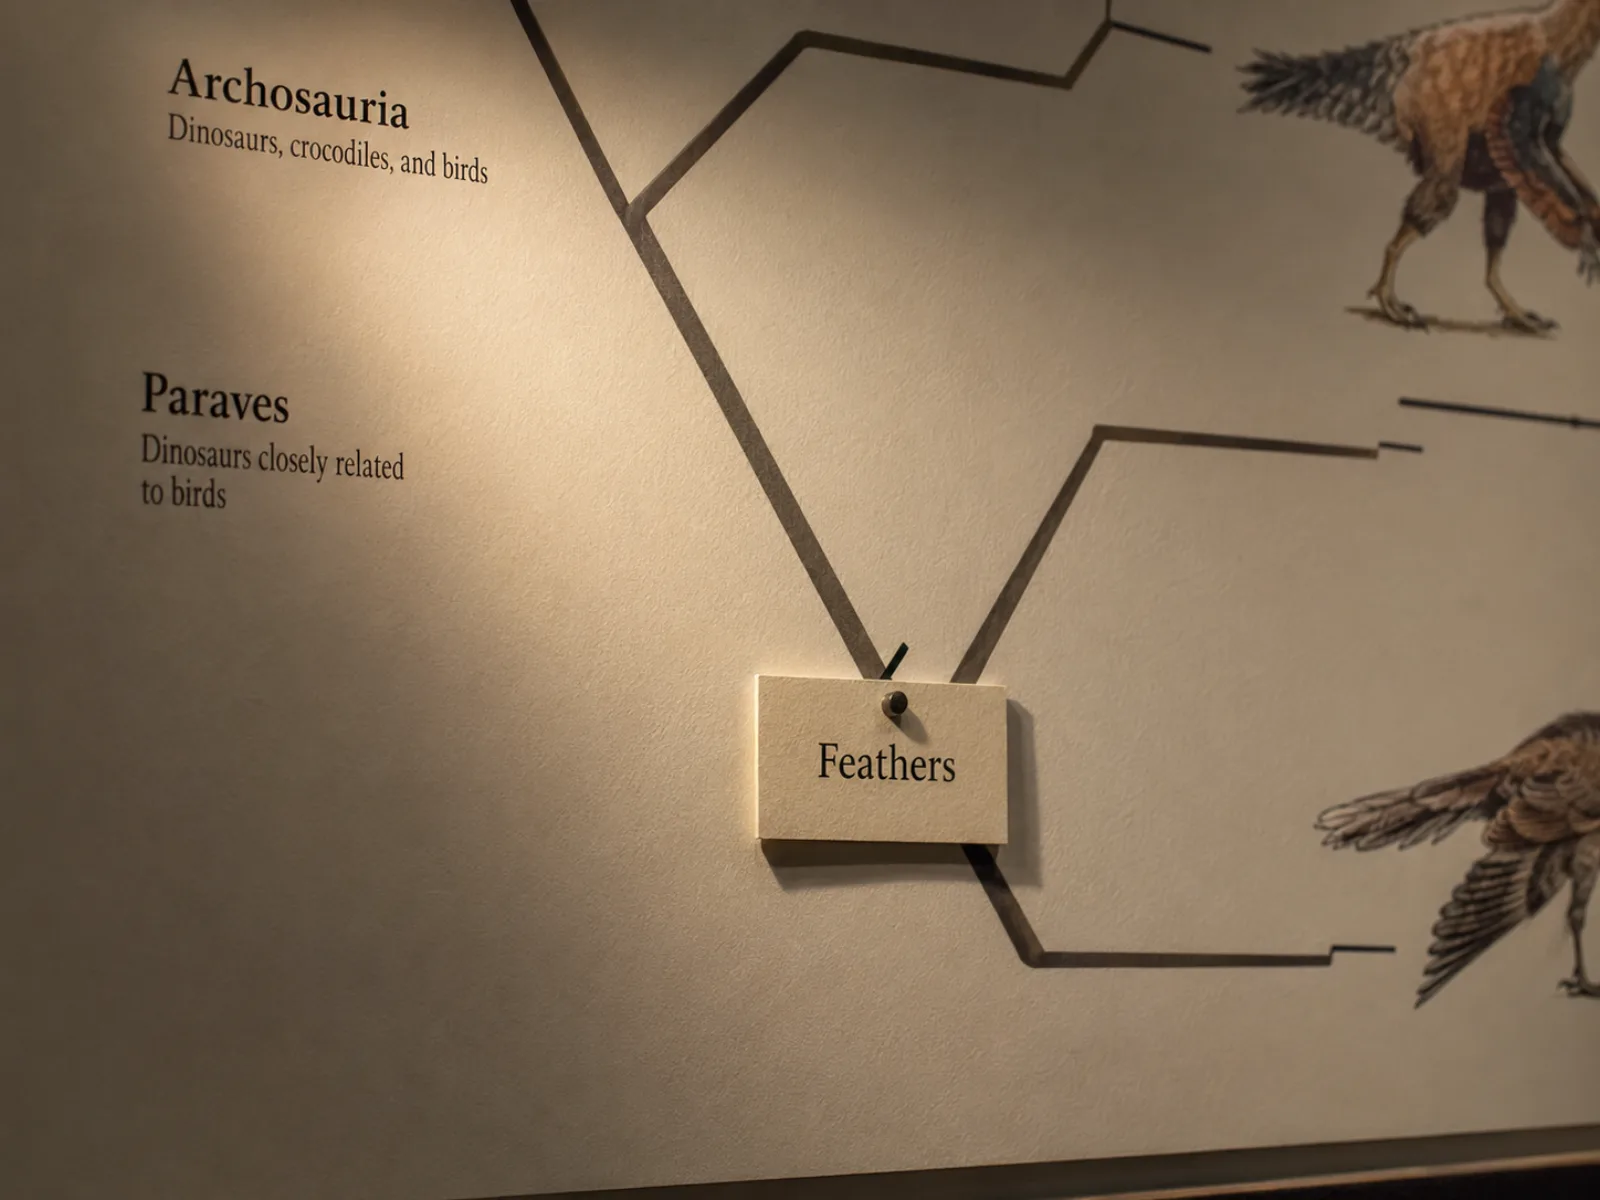
A cladogram is only useful for teaching if it shows why lineages were grouped together. Attach a shared derived trait to any node — four limbs, an amniotic egg, feathers — and the cladogram maker renders it as a small tick mark with a caption, right where the trait would have first appeared.
Common questions about cladograms and how to build one with this tool.
No installation, no file conversion — type your taxa and download a diagram ready for a lab report or a lecture slide.