

Paste a distance matrix or a list of merge heights, pick a linkage method, and this dendrogram maker clusters it live and draws a scaled tree with a distance axis — ready to export as SVG or PNG.
A distance axis and a cut line do the real work here — these four dendrograms, made with the dendrogram maker, show how merge order becomes a defensible number of clusters.
Five genes clustered by expression-profile distance under average linkage, with a cut line at height 3.0 marking where the data splits into two groups.
A marketing-analytics dendrogram built from a pairwise distance matrix, showing how single linkage chains customers together at low distances before larger merges.
A text-mining dendrogram clustering documents by cosine-distance similarity under complete linkage, useful for spotting topic clusters before manual review.
An ecology dendrogram grouping microbiome samples by community composition distance, with the axis scaled to the same units as the underlying distance metric.
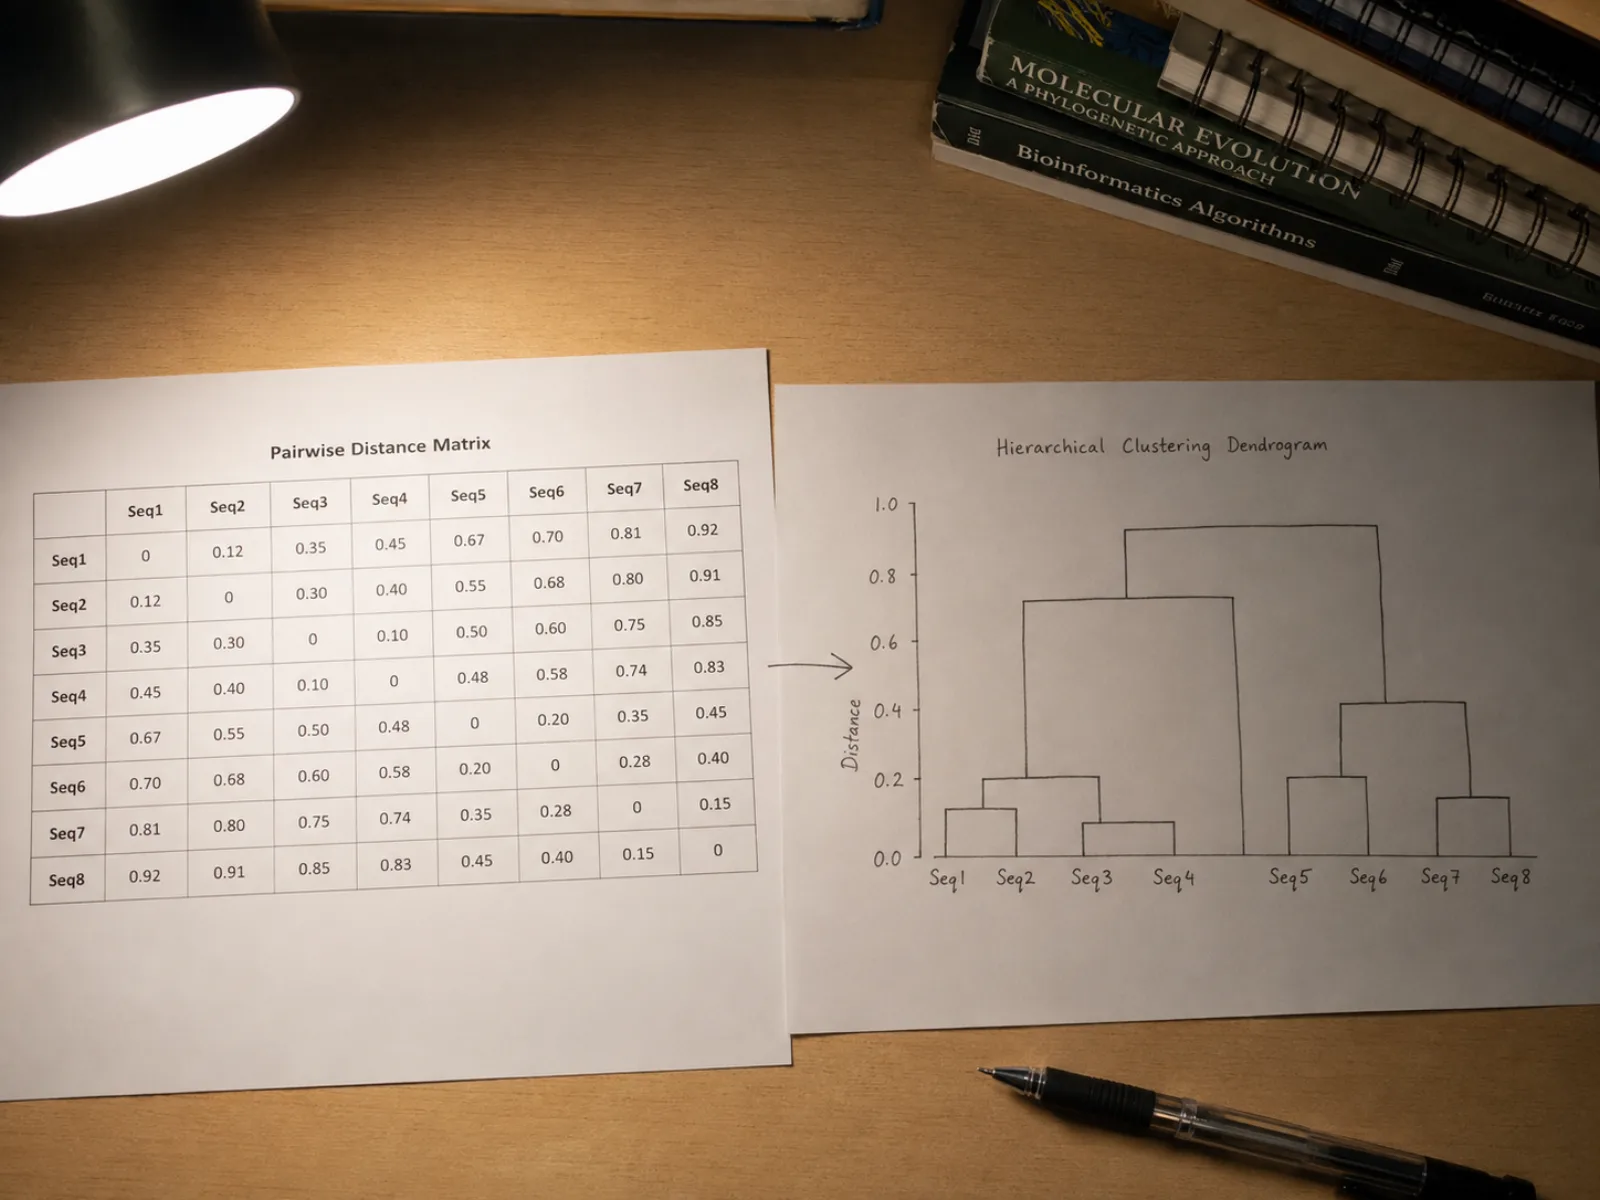
Paste a pairwise distance matrix as CSV and the dendrogram maker runs agglomerative hierarchical clustering on it directly — no notebook, no package install. Every merge height in the resulting dendrogram is computed from your data, not estimated.
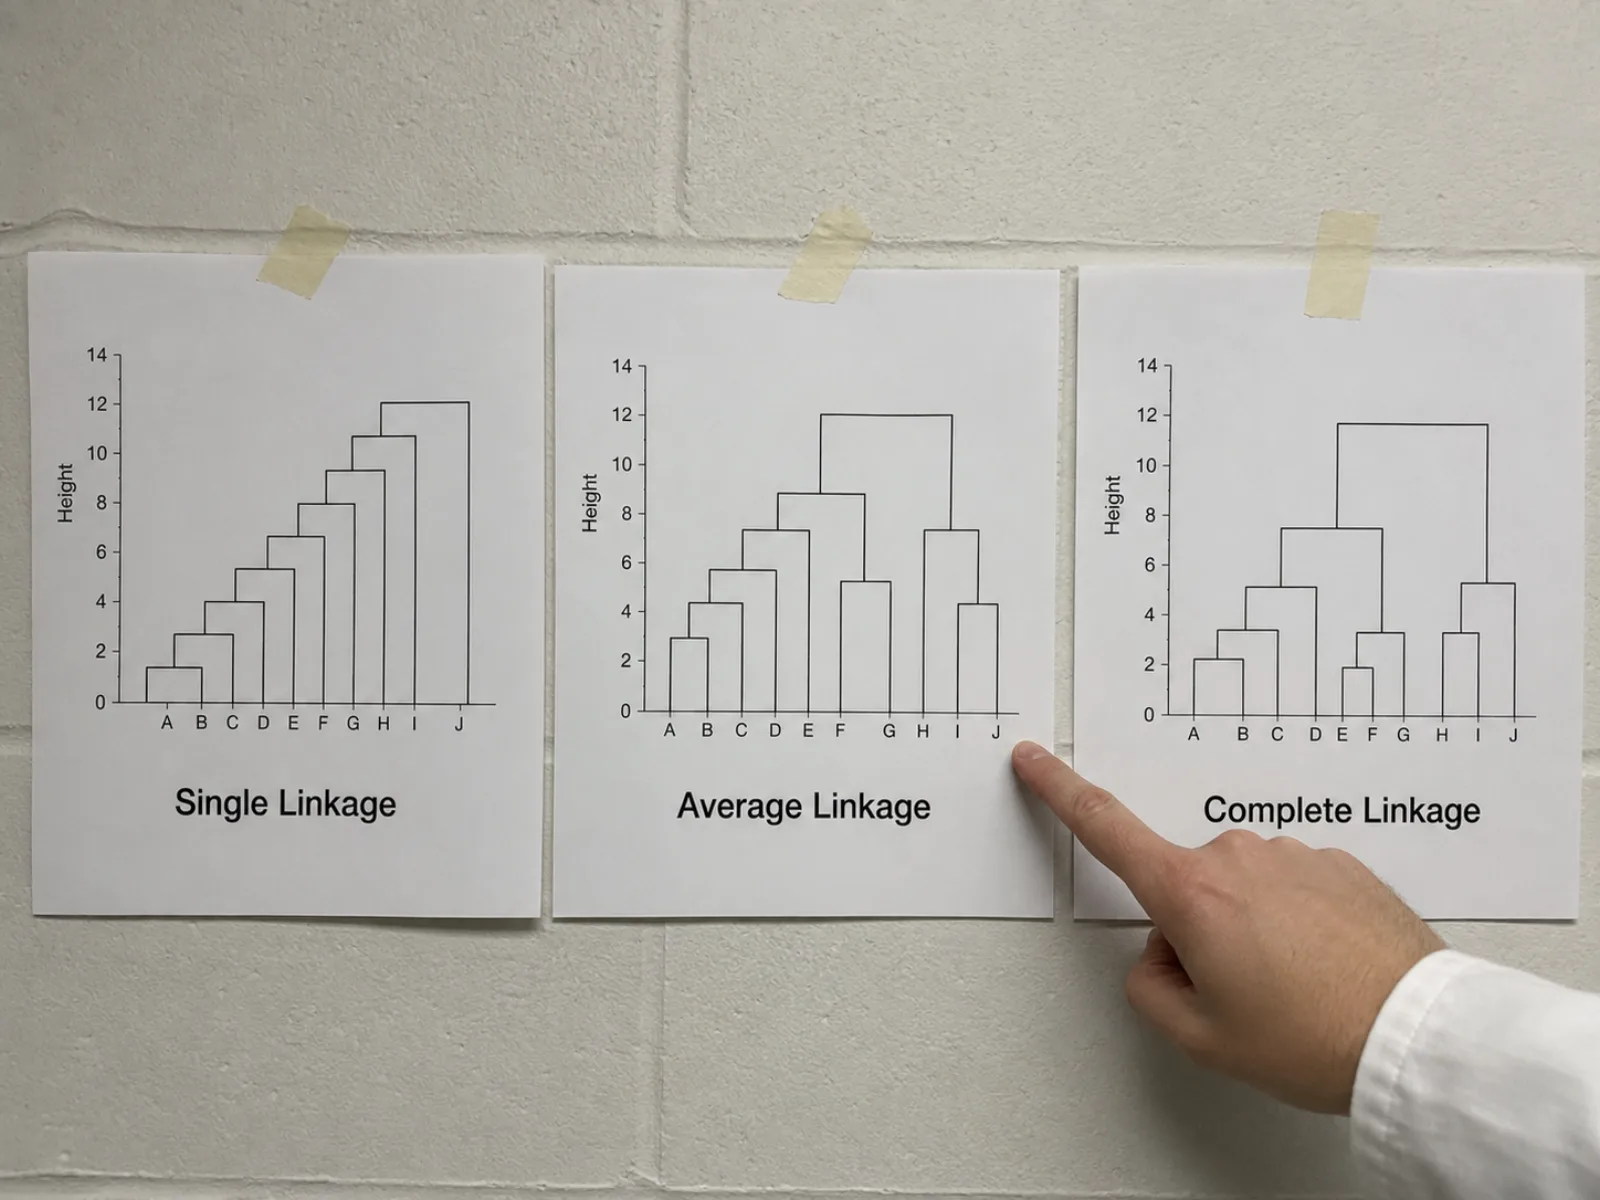
Linkage method changes where merges happen and how compact the resulting clusters look — average linkage balances the two, single linkage tends to chain nearby points together, complete linkage favors tight, evenly sized clusters. Switch methods on the same matrix to see how the dendrogram maker's output shifts before you commit to one.
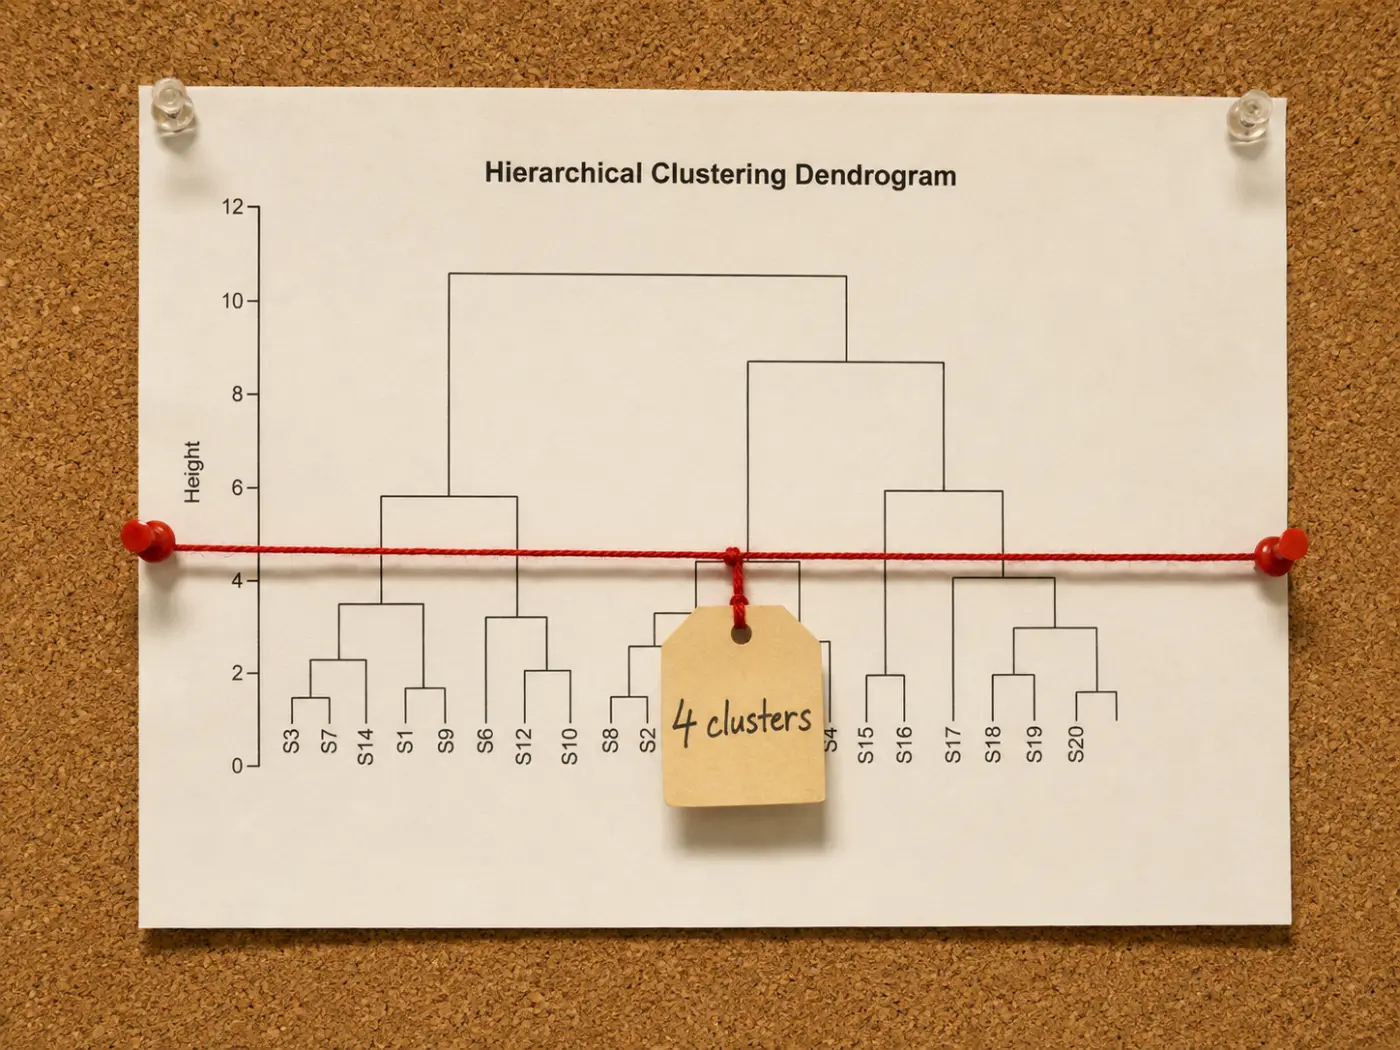
Drop a horizontal cut line at any distance threshold and the dendrogram maker counts and reports how many clusters that cut produces — the standard way to defend a chosen number of groups instead of picking one arbitrarily.
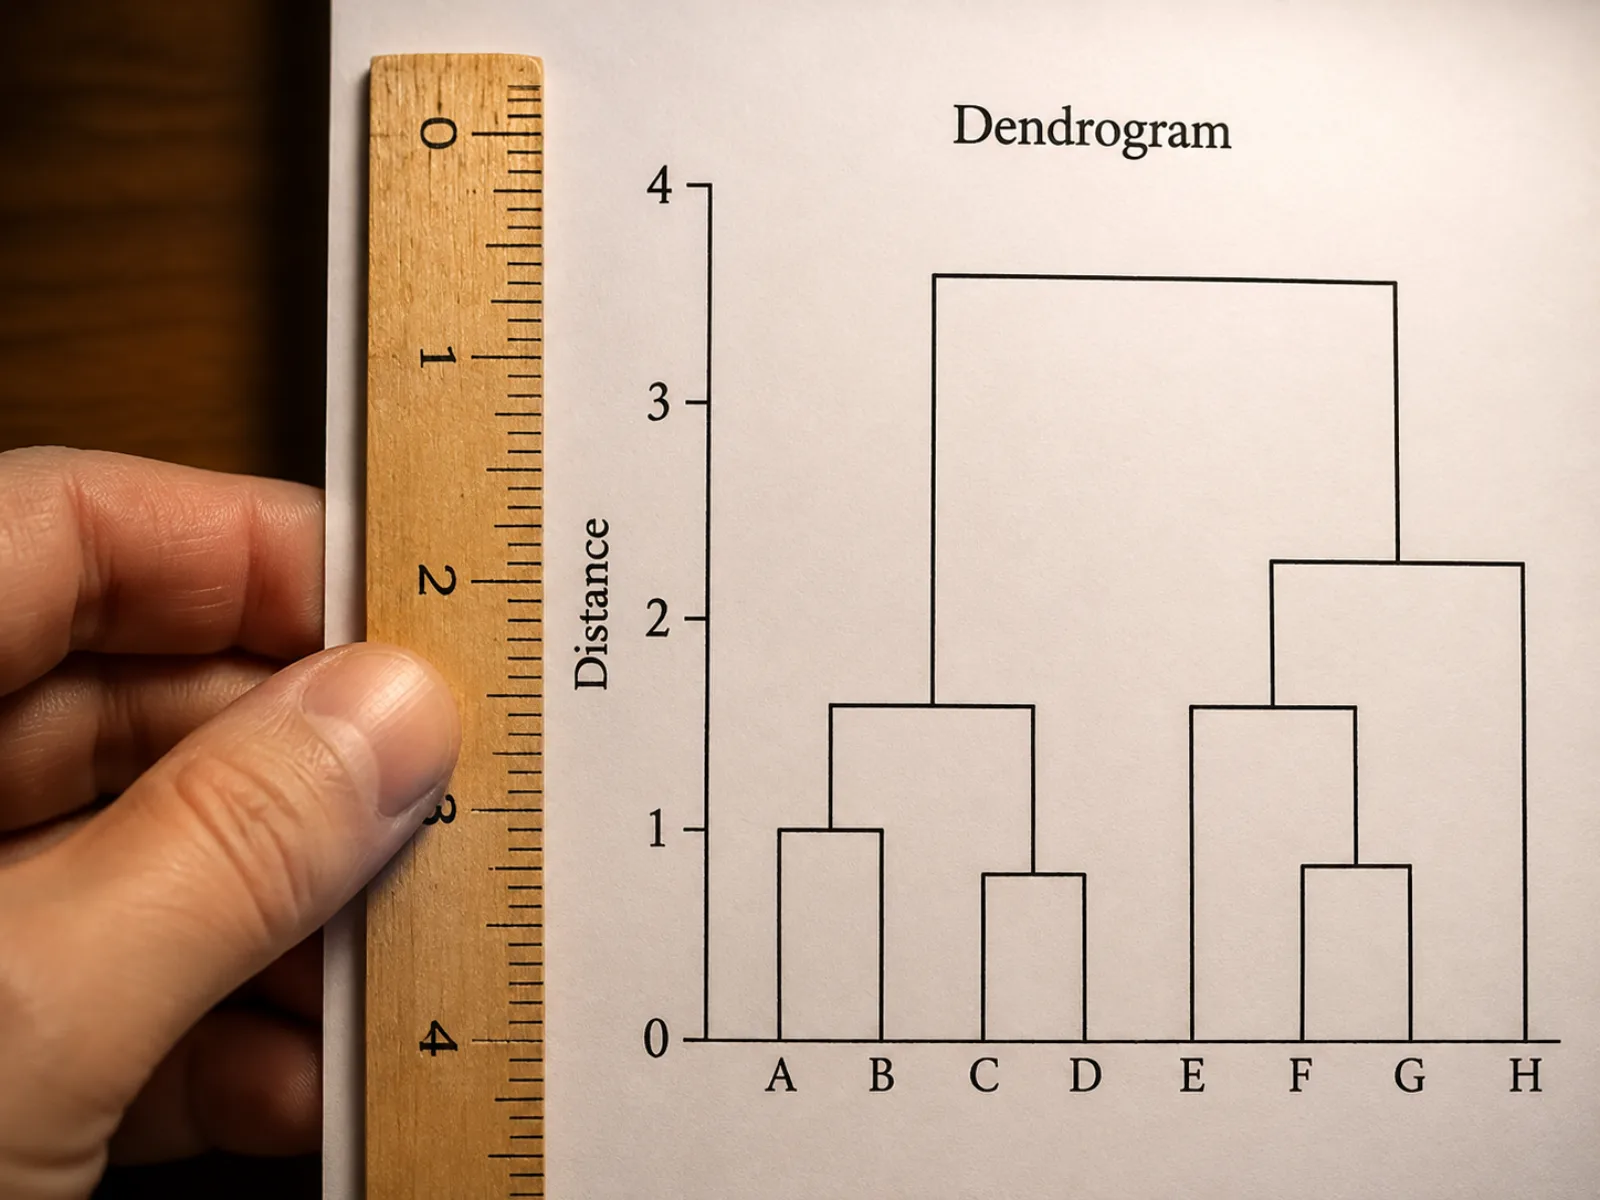
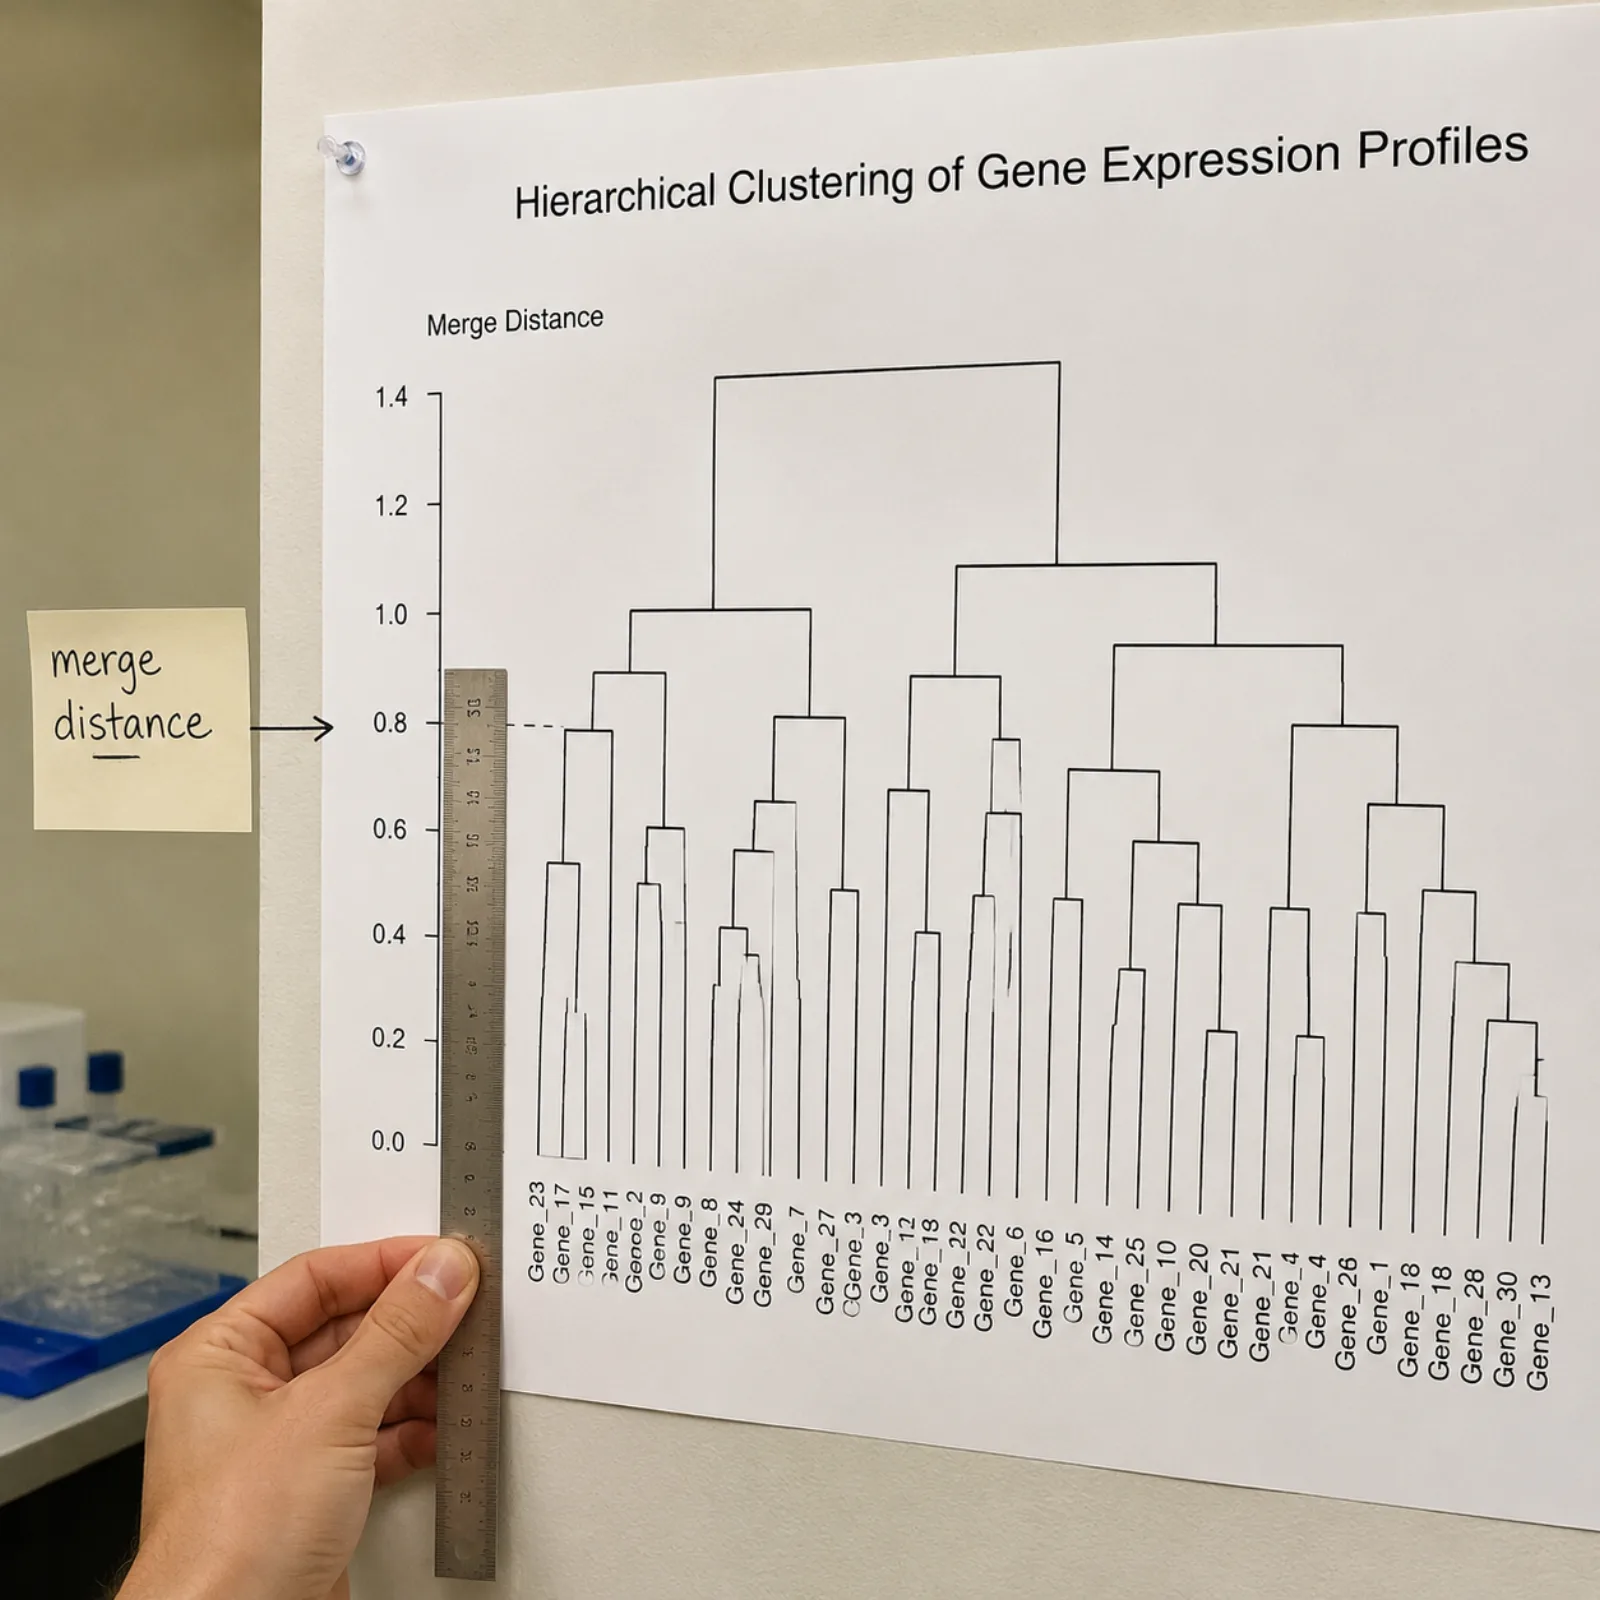
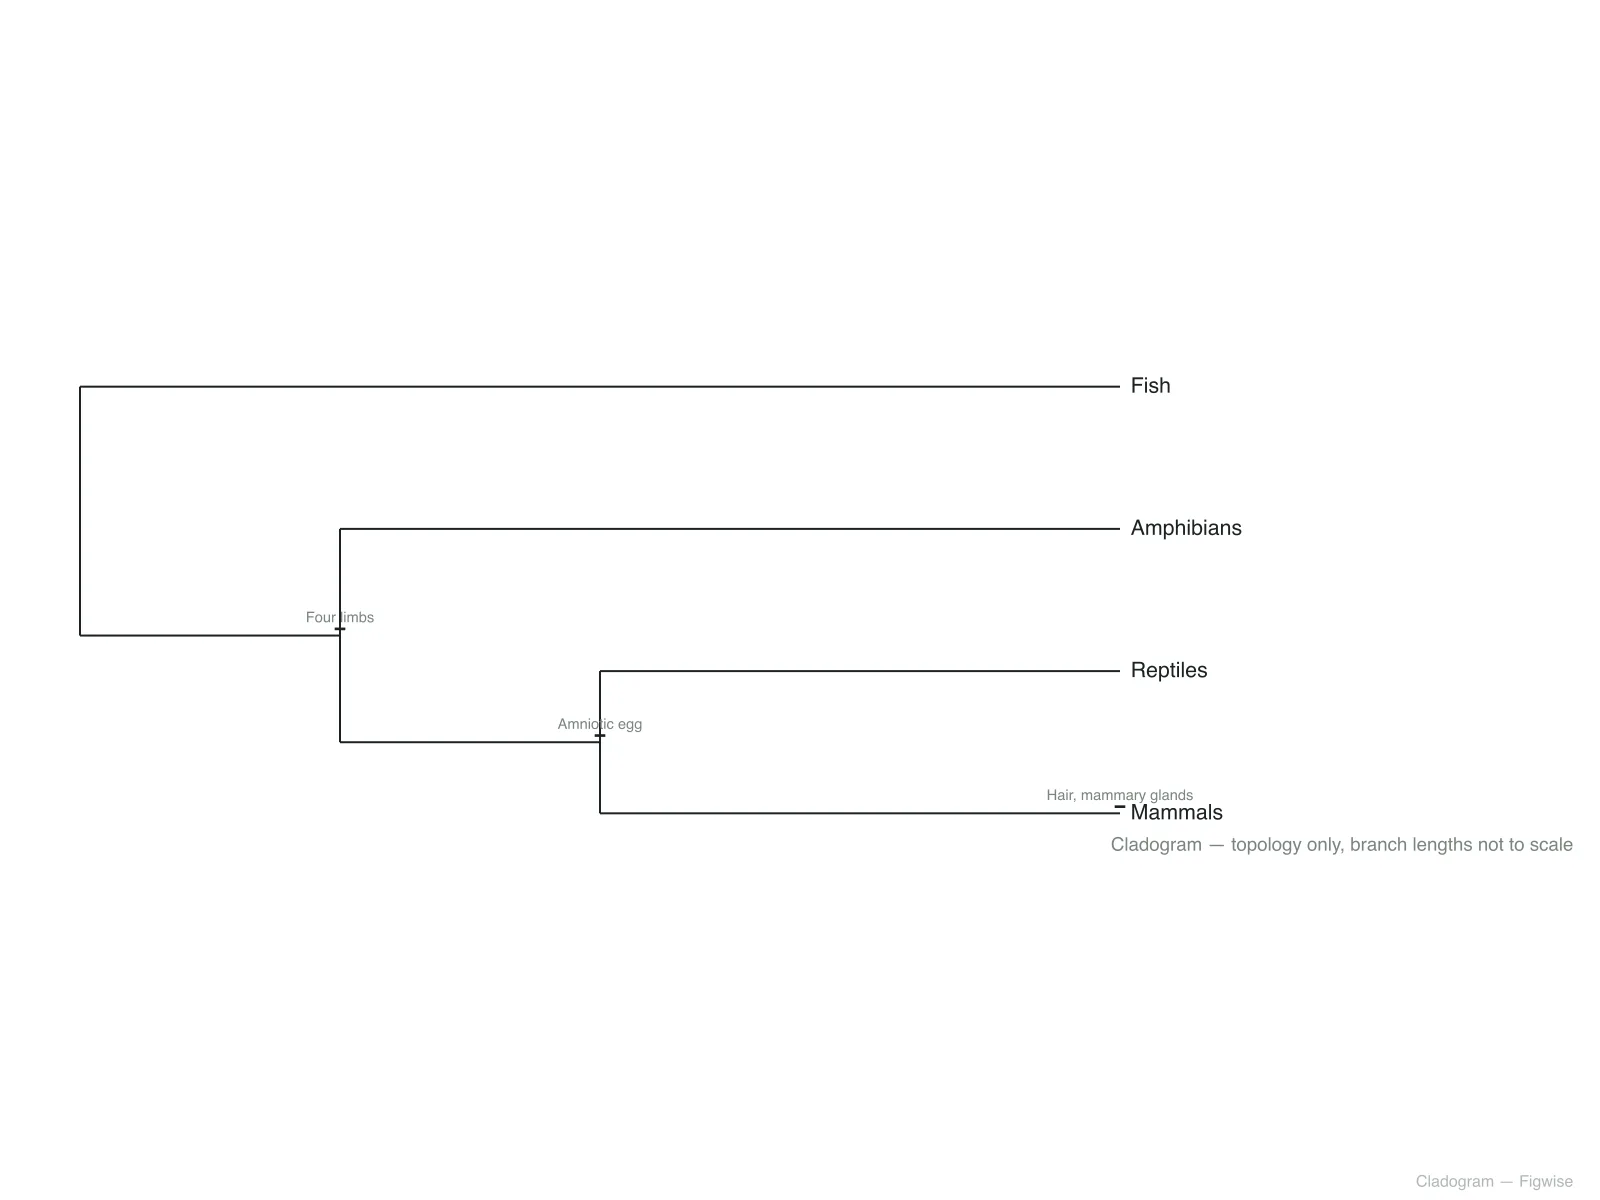
Unlike a cladogram, a dendrogram's branch height is data — it is the distance or dissimilarity at which two clusters merged. The dendrogram maker draws a labeled axis in the same units as your input, so the vertical position of every join is something you can actually measure.
Four steps from raw distances to a scaled, exportable dendrogram.
Paste a pairwise distance matrix as CSV (blank top-left cell, labels on the first row and column), or paste pre-computed merge-height data if your clustering already ran elsewhere.
When clustering from a matrix, pick average, single, or complete linkage. This choice changes the resulting merge order and heights, so pick the one that matches your analysis, not the default.
Turn on the cut line and set a distance threshold; the dendrogram maker reports how many clusters exist at that height, which you can adjust until the grouping matches your data.
Download an SVG for a vector figure you can relabel for a paper or slide deck, or a 2× PNG for a report.
A dendrogram is a tree diagram that records the order and height at which items were merged during hierarchical clustering. Unlike a cladogram, where branch length carries no meaning, a dendrogram's branch height is real data: it is the distance or dissimilarity value at which two clusters were joined, read directly off a labeled axis.
Two choices decide what a dendrogram actually shows. The first is the distance metric — Euclidean distance, correlation distance, cosine distance, and others each define "similar" differently, so the same raw data can produce different merge heights depending on which one you pick. The second is the linkage method: average linkage merges clusters based on mean pairwise distance, single linkage merges based on the closest pair (which can chain distant points together through intermediates), and complete linkage merges based on the farthest pair (which favors tight, compact clusters). Changing either the metric or the linkage method can change which groups look natural in the resulting dendrogram, so both choices belong in your methods section, not just in the software defaults.
Once a dendrogram is built, a horizontal cut line at a chosen distance threshold turns the continuous merge structure into a discrete number of clusters — cut lower and you get more, smaller clusters; cut higher and you get fewer, broader ones. This is the standard way researchers justify a specific cluster count from cluster analysis, rather than asserting one without evidence.
Common questions about dendrograms, linkage methods, and how to build one with this tool.
Paste a distance matrix or merge heights and download a scaled dendrogram ready for a paper, poster, or report.