

 Figwise Team
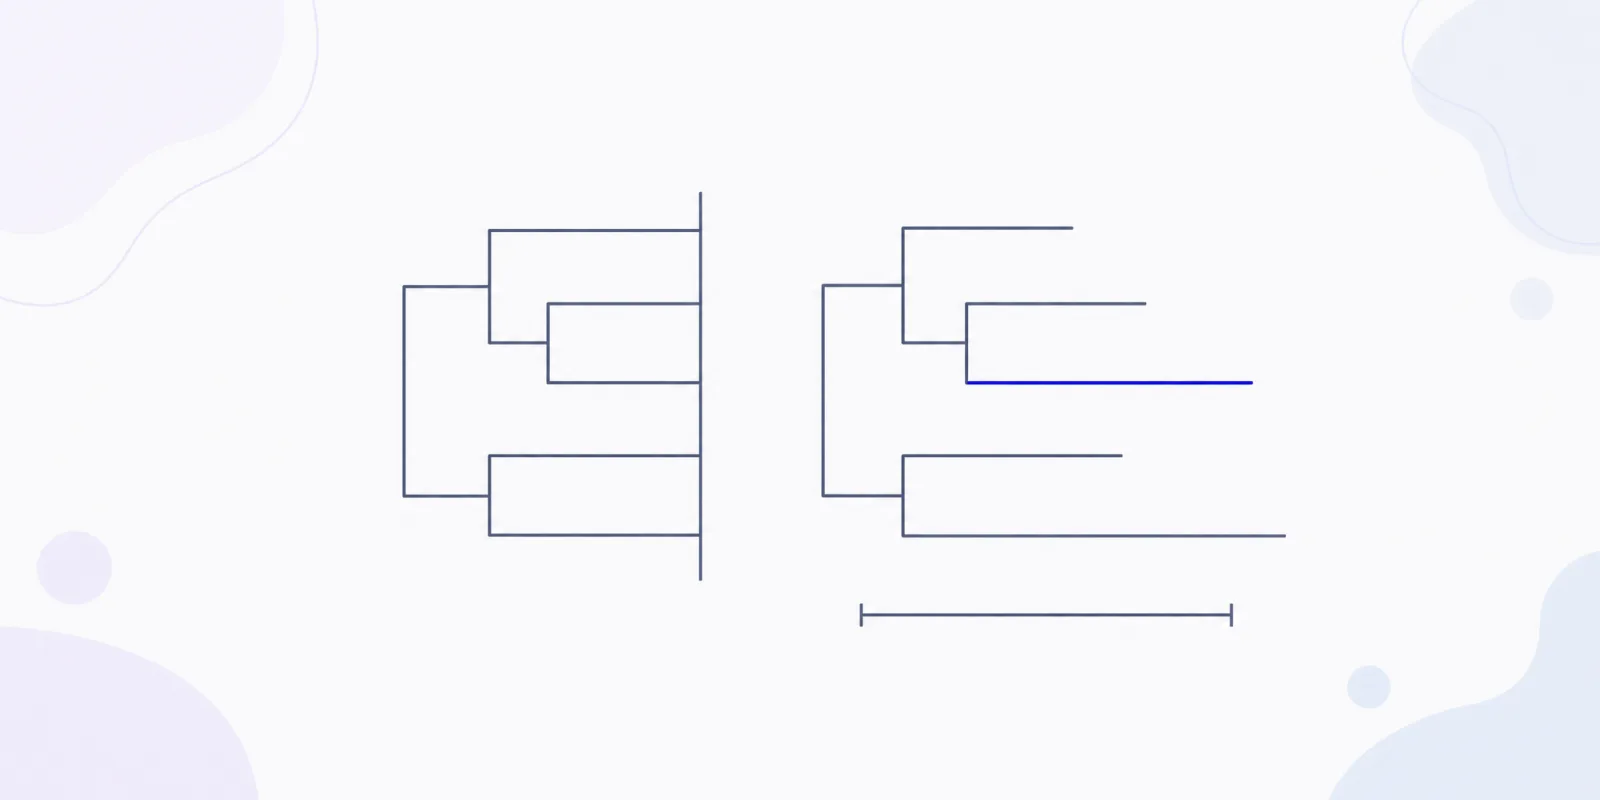
A cladogram and a phylogenetic tree can show the exact same branching pattern. The difference sits in the branches. On a cladogram, branch length carries no information at all. On a scaled tree, branch length is data — either genetic change or time.
That one rule sets the limit on what you may claim from a figure. Most pages on this topic stop there, and several get the rest wrong: they say cladograms come from traits and phylogenetic trees come from DNA. Both can be built from either.
Here is the useful part instead: a three-check test for telling which tree is in front of you, four steps for reading it, and the six misreadings that show up most in exam answers and paper drafts.
The difference in one rule
Branch length either means something or it doesn't. Everything else follows from that.
| Cladogram | Phylogram | Chronogram (time tree) | |
|---|---|---|---|
| Branch length | No meaning | Amount of change | Elapsed time |
| Scale bar or axis | None | "0.05 substitutions per site" | "Ma", "Myr", years |
| Tips | All flush on one line | Ragged | Flush if every sample is from today, staggered if samples carry dates |
| What you may claim | Branching order only | Order plus how much change | Order plus dates |
The open-access primer by T. Ryan Gregory puts the cladogram rule bluntly: "the lengths of individual branches on a cladogram do not convey any information whatsoever." Phylograms, by contrast, show branch lengths "proportional to some measure of divergence" and "typically include a scale bar."
Note what that source counts as divergence: comparisons of DNA sequences or of physical features. So the data type is not the dividing line.
A parsimony tree from bone measurements can be a phylogram. A tree from a genome can be drawn as a bare cladogram. What matters is whether the person who drew it scaled the branches.
Three checks to tell which one you are holding
Run these in order. Ten seconds, and you know what the figure is allowed to tell you.
- Look for a scale bar or an axis. A short bar labelled
0.05means substitutions per site. An axis in Ma or Myr means time. No bar and no axis? Treat the figure as a cladogram and claim nothing about amounts. - Look at the tips. Ragged tips mean the branches are scaled to something — change if the bar reads in substitutions, dates if the axis reads in years. Flush tips mean either a cladogram or a time tree of present-day samples, so you still need check 1 to split those two.
- Read the method line in the caption. "Maximum likelihood, GTR+G, 1000 bootstrap replicates" describes a tree with real branch lengths. "Strict consensus of 12 equally parsimonious trees" usually means you are looking at topology alone.
Check 2 is where people slip, in both directions. Flush tips feel like "no length information," but a time tree of living species also has flush tips, because every sample comes from today. And ragged tips do not always mean a phylogram: fossil-calibrated trees and trees of samples collected on different dates stagger their tips in time units. The scale is what settles it — substitutions per site, or years.
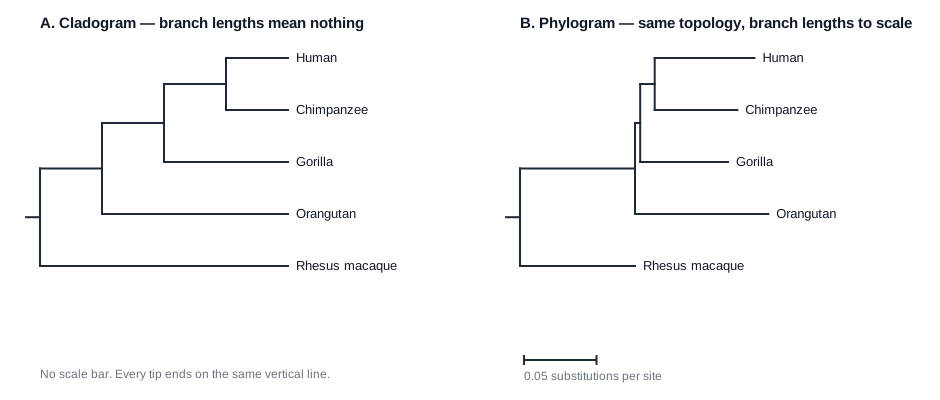
Same topology, two drawings. Both panels come from one neighbour-joining tree that I built for this article from the cytochrome b coding sequence of five RefSeq mitochondrial genomes: human (NC_012920.1), chimpanzee (NC_001643.1), gorilla (NC_011120.1), orangutan (NC_002083.1) and rhesus macaque (NC_005943.1). Distances are Jukes-Cantor corrected; the root sits at the midpoint of the macaque branch.
What a scaled branch actually counts
A phylogram's units are usually substitutions per site. A bar of 0.05 stands for about five changes in every hundred aligned positions. To get the total divergence between two tips, add up every branch on the path from one tip down to their shared ancestor and back up to the other tip.
Two warnings before you do that arithmetic on a real figure. The percentages in the table below are raw differences, while the drawn branches are Jukes-Cantor corrected, so the two will not match. And the root here sits at the midpoint of the macaque branch, which splits that branch in half across the figure.
Here are the real numbers behind the figure above. The cytochrome b gene is 1,141 bases long in all five primates, with no gaps to align around:
| Pair | Differing sites (of 1,141) | Percent |
|---|---|---|
| Human vs chimpanzee | 132 | 11.6% |
| Human vs gorilla | 142 | 12.5% |
| Chimpanzee vs gorilla | 137 | 12.0% |
| Human vs rhesus macaque | 241 | 21.1% |
Two things fall out of that table. Human and chimpanzee are the closest pair, which matches the accepted branching order.
And the human branch in panel B (0.069) is longer than the chimpanzee branch (0.057), so this gene has picked up more changes on our side since the split. That is a claim you can only make from a phylogram. Panel A holds the same topology and cannot support it.
Time trees work the other way round. They put dates on the nodes and hide rate differences, so you can read "these two split about 6 million years ago" but not "this lineage changed faster." Rates vary between lineages, so never read a phylogram's branch length as elapsed time.
Read any tree in four steps
1. Find the root, then find the outgroup
The root is the deepest point in the figure, and it is what turns a web of relationships into a history. Trees get rooted with an outgroup: a group that sits outside the set you care about, but close enough to align with it. Gregory's primer notes that outgroup species are "necessary to root an evolutionary tree."
Pick the closest relative that is still clearly outside your group. Too close and it belongs inside; too distant and its long branch drags the root to the wrong place. In my figure the macaque plays this part for the four apes.
One warning about wording: the branch to the outgroup often gets called "basal," and Gregory advises against it, because readers take it to mean primitive or ancestral. The macaque is not an ancestor of anything else on that tree. It is a modern species with just as much history behind it.
2. Read internal nodes as ancestors, not as species
Each internal node is one ancestral population that split in two. It is not either of its descendants. The classic version of this error: whales and hippos are sister groups, which does not make the whale ancestor a hippo. Fossil early whales such as Pakicetus look nothing like a hippo.
The same logic answers the tired question about humans and chimps. We are not descended from chimpanzees. We share a node with them.
3. Name the sister groups
Two tips are sister groups when they meet at a node that nothing else joins. Human and chimpanzee are sisters in the figure. Gorilla is sister to that whole human-plus-chimpanzee pair, not to either one alone.
Say relatedness out loud in node terms and most confusion disappears: the pair with the more recent shared node is the more closely related pair. Berkeley's Understanding Evolution states the rule as "common ancestry is the currency of evolutionary relatedness."
4. Check the support values before you trust a node
Numbers next to a branch tell you how repeatable that branch was, not how old or how correct it is. Thresholds depend on which method produced them, and they are not interchangeable:
- Standard bootstrap (BS) runs conservative. In the ultrafast bootstrap paper, a standard bootstrap value of 80% already carries a 0.95 chance of being correct, and the authors describe trusting splits at 80% or more as widely accepted. The older and looser rule of thumb, 70%, traces back to Hillis and Bull's 1993 test in Systematic Biology 42:182–192.
- Ultrafast bootstrap (UFBoot) is close to unbiased, so its numbers run higher for the same branch. The IQ-TREE FAQ says to "only start to rely on a branch if its support is >= 95%," and warns you should not compare BS% with UFBoot% directly.
- SH-aLRT pairs with UFBoot; the same page suggests 80% or more, and treats a branch as solid when SH-aLRT ≥ 80% and UFBoot ≥ 95%.
- Bayesian posterior probability runs 0 to 1, and 0.95 is the usual cut. Read it with care: Suzuki, Glazko and Nei showed these values can be too high.
If a node carries no number, the figure is telling you nothing about its support. Do not build an argument on it.
Terms you need, one line each
- Clade — an ancestor plus every one of its descendants, living and extinct.
- Monophyletic group — a clade. Nothing missing, nothing extra.
- Paraphyletic group — an ancestor and some descendants. "Reptiles" without birds is the standard case.
- Topology — the branching pattern alone, stripped of lengths.
- Polytomy — a node with three or more descendant lineages instead of two, usually meaning the data could not resolve the order.
- Branch support — a repeatability score attached to a branch, such as a bootstrap value.
Six ways trees get misread
Use this as a checklist against your own reading of a figure.
- Reading across the tips. Asked whether a frog is closer to a fish or a human, most readers pick the fish because it sits next door. Wrong: frogs and humans are both tetrapods, and both are equally related to teleost fishes. Tip order is meaningless, because every node can be rotated freely — Gregory compares a tree to a baby's mobile.
- Left to right as progress. Nothing on a tree is more advanced than anything else. Berkeley's trees, not ladders page traces the habit back to the Great Chain of Being, and points out that which lineage gets drawn on the left is arbitrary.
- Living species as each other's ancestors. All the tips of a normal tree are contemporaries. None of them gave rise to another.
- Counting nodes to rank relatedness. Node counts change when you add or drop taxa. Berkeley's worked case: three nodes separate amphibians and echinoderms until you add sharks, and then it is four — while their actual relatedness has not moved.
- Reading a long branch as "nothing happened." A long, node-free branch means one lineage with no recorded splits, not a lineage that stopped evolving. The reverse error is just as common: change does not occur only at nodes.
- Reading spacing on a cladogram. Tall gaps, short gaps, long branches, short branches — on a cladogram, none of it is data.
Real trees to practise on
- Nextstrain's SARS-CoV-2 build has a Branch Length switch with two settings, TIME and DIVERGENCE. Flip it and watch one topology redraw itself as a time tree and then as a phylogram. It is the fastest way to feel the difference.
- Gregory's Figure 8 shows one topology as a cladogram, a phylogram and an ultrametric tree, side by side, with the reasoning spelled out.
- NCBI's Common Tree builds a tree from a species list using NCBI's taxonomy. Because taxonomy has no branch lengths, what comes out is topology — a cladogram.
- TimeTree answers the other question: it returns published divergence dates for a pair of species, which is chronogram territory.
So which one should you draw?
Draw the tree that matches the claim in your figure caption.
- Order of events only — a cladogram is honest and easy to read.
- One lineage changed more — you need scaled branches plus a scale bar.
- Dates on the splits — you need a time axis, and support values on the nodes that carry your argument.
Whichever you pick, the mechanics are the same three inputs: a topology, optional branch lengths, and labels. Our phylogenetic tree generator takes a Newick string or a plain species list and exports SVG or PNG. Feed it Newick without lengths and you get a true cladogram: flush tips, no scale bar, nothing implied that your data does not support. If the tree ends up as one panel of a summary figure, the graphical abstract maker handles that layout.
One thing to settle before submission: if any part of your figure came out of an AI tool, check what your target journal requires you to disclose. We collected the current rules in AI-generated figures and journal policies.
FAQ
Is a cladogram a phylogenetic tree?
It is one kind of phylogenetic tree — the kind that shows only branching order. Many biologists use the words interchangeably, which is exactly why the three checks above are worth running instead of trusting the label in the caption.
Do cladograms show time?
No. Not the branch lengths, not the spacing, not the order of the tips. If a figure has no axis and no scale bar, it makes no claim about time or amount of change.
How do I choose an outgroup?
Take the nearest group that everyone agrees falls outside your ingroup, and that you can align reliably. Check afterwards that it did not come out inside the ingroup — if it did, your ingroup was not what you thought it was.
What bootstrap value is good enough?
For standard bootstrap, 80% or more is the usual line, with 70% as an older and weaker one. For ultrafast bootstrap, use 95%. Never move a UFBoot number and a standard bootstrap number onto the same scale.
Two species sit side by side at the tips. Are they close relatives?
Not necessarily. Rotate any node and the tip order changes while the tree stays identical. Trace both tips down to the node where they meet, and compare that node with the alternatives. That is the only test.